Reference
All 176 functions
Every command-bar function, grouped by task, with what it shows and which plan it needs.
How to run a function6 patterns
Type the shortcut in the command bar (Ctrl+P or Cmd/Ctrl+K), add the argument if one is shown, press Enter. F1 or HELP <function> shows a function's keys and how fresh its data is.
pro needs Pro, cloud needs a Gloom Cloud account, and plugin installs with PL or gloom install gloom-sh/<repo>. term.gloom.sh already has POLL and PM.
| Pattern | Meaning | Example |
|---|---|---|
PREFIX | Open a pane or workflow. | TOP |
PREFIX <ticker> | Ticker-scoped pane. | GP NVDA |
PREFIX <tickers> | Multi-ticker pane. | QQ AAPL, MSFT, NVDA |
PREFIX <query> | Seed a search or text workflow. | PM inflation |
| Ticker | Plain or exchange-qualified. | AAPL, AAPL:XNAS |
| Command name | Run a workflow without a prefix. | New Layout |
No prefix, search by name: Export Config and Import Config save and load ~/gloomberb-config-backup.json; Reset All Data asks to confirm, deletes all local data and quits; the next launch starts setup.
Research companies
70Everything scoped to one ticker or a peer group.
DESSecurity overview
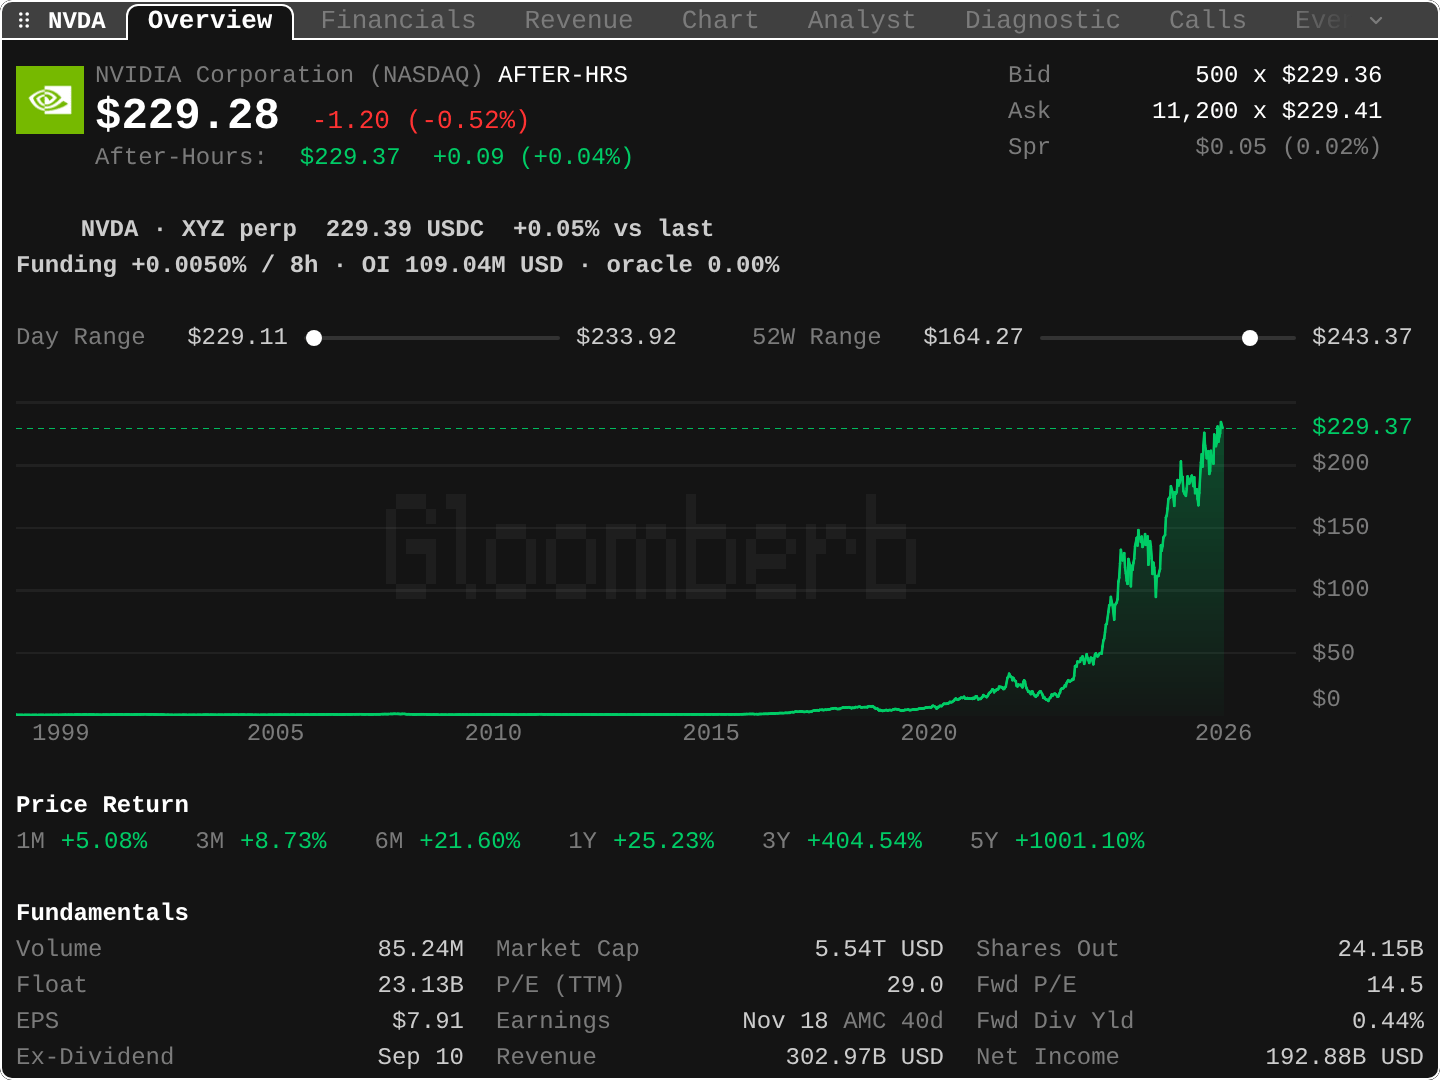
Quote, chart, and research tabsThe starting point for any ticker: live quote, day and 52-week range, price chart, fundamentals, and tabs into every other research pane. T is the same pane; search Ticker Research to open a second one.
- Example
DES NVDA - Learn it in the Academy: The overview page (DES)
- Example
QQQuote monitor
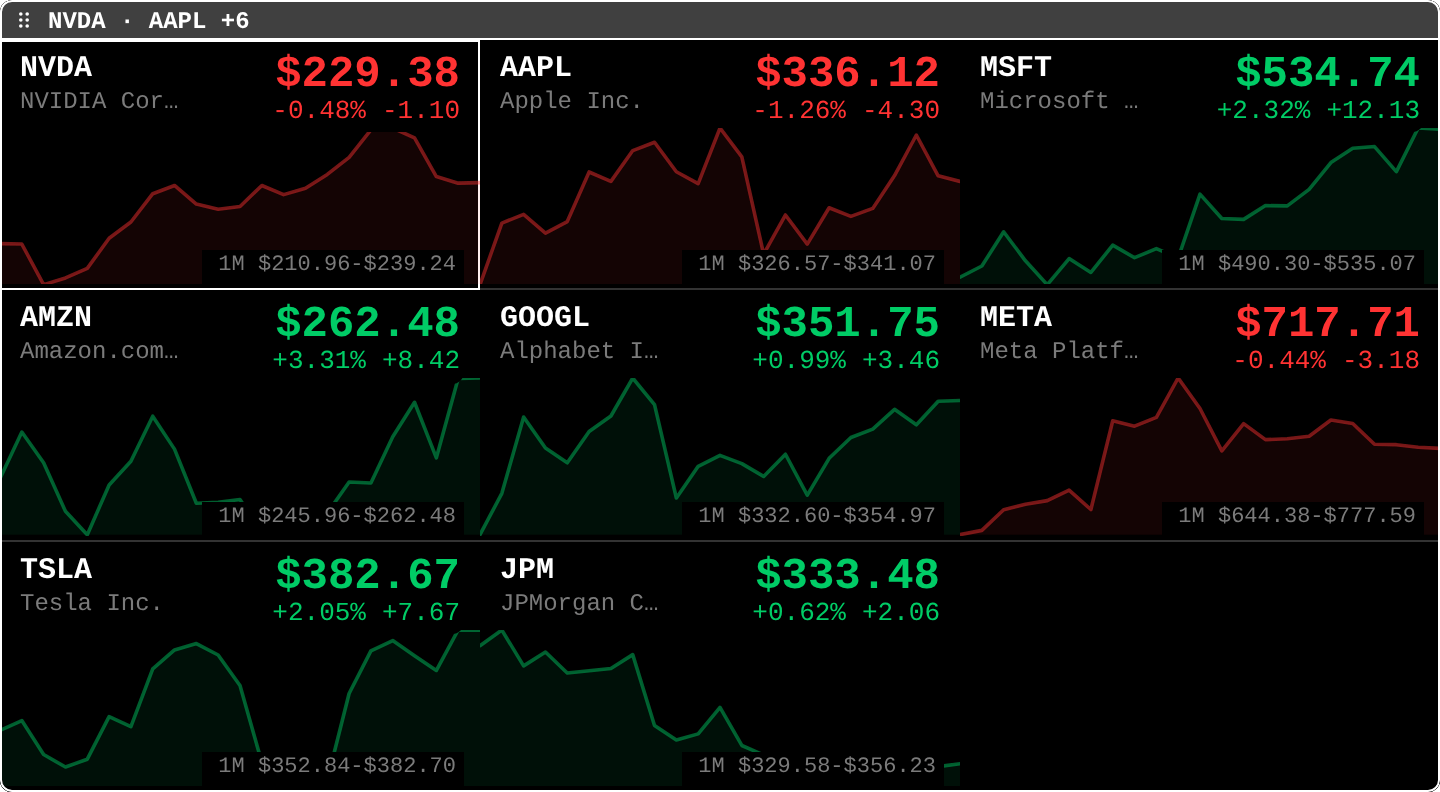
Quote board with sparklinesA compact board of live quotes for any list of tickers, each with change, range, and a sparkline. Good as the always-open strip in a layout.
- Example
QQ NVDA, AAPL, MSFT - Learn it in the Academy: A board of quotes (QQ)
- Example
GPPrice chart
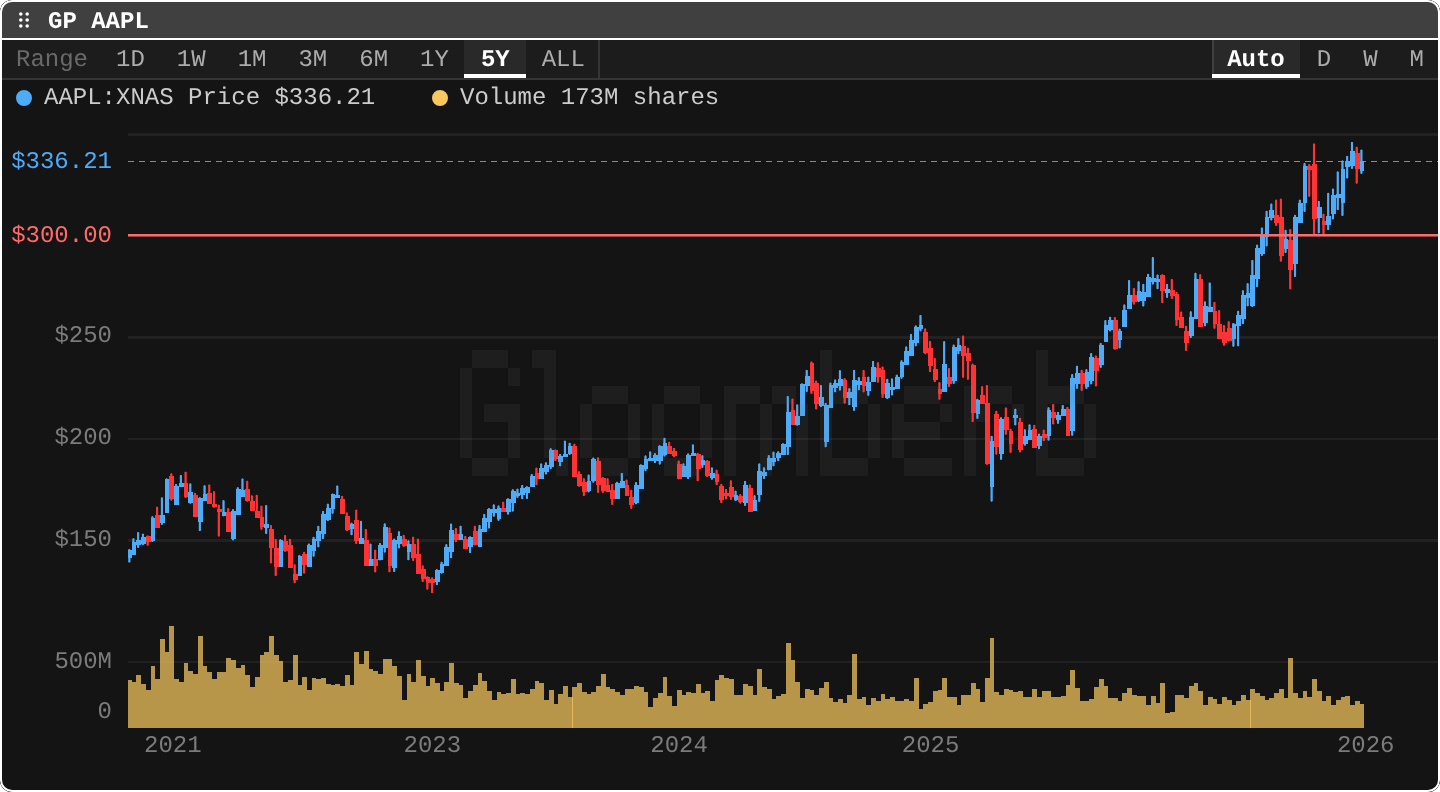
Long-range price chartA price chart with volume in the chart composer, defaulting to a multi-year range. Add indicators, drawings, or other series from the same pane.
- Example
GP AAPL - Learn it in the Academy: Reading a price chart (GP)
- Example
GIPIntraday chart
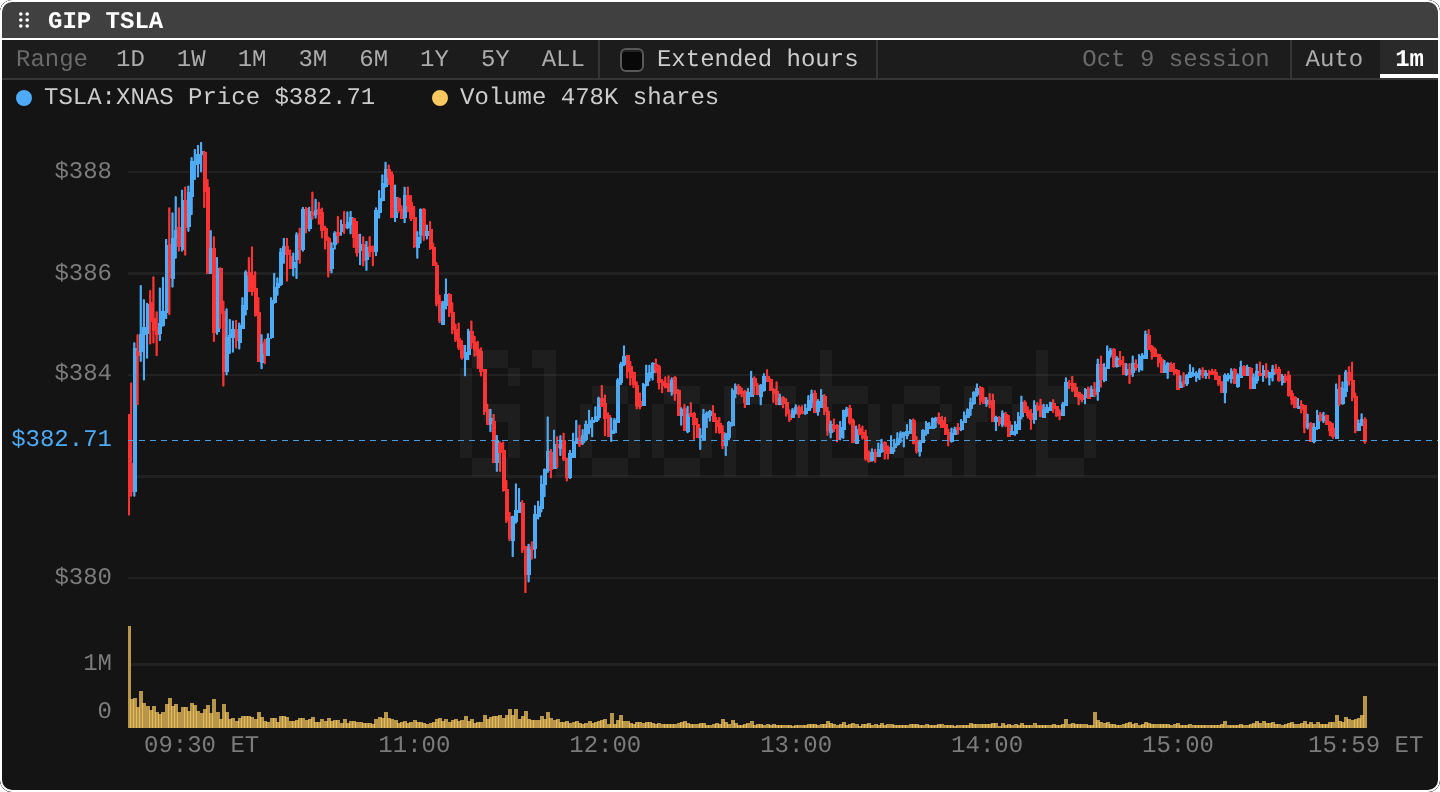
Intraday candlesOne or five sessions of intraday candles with the session boundaries marked. Real-time on Pro, 15-minute delayed on Free.
- Example
GIP TSLA - Learn it in the Academy: The intraday chart (GIP)
- Example
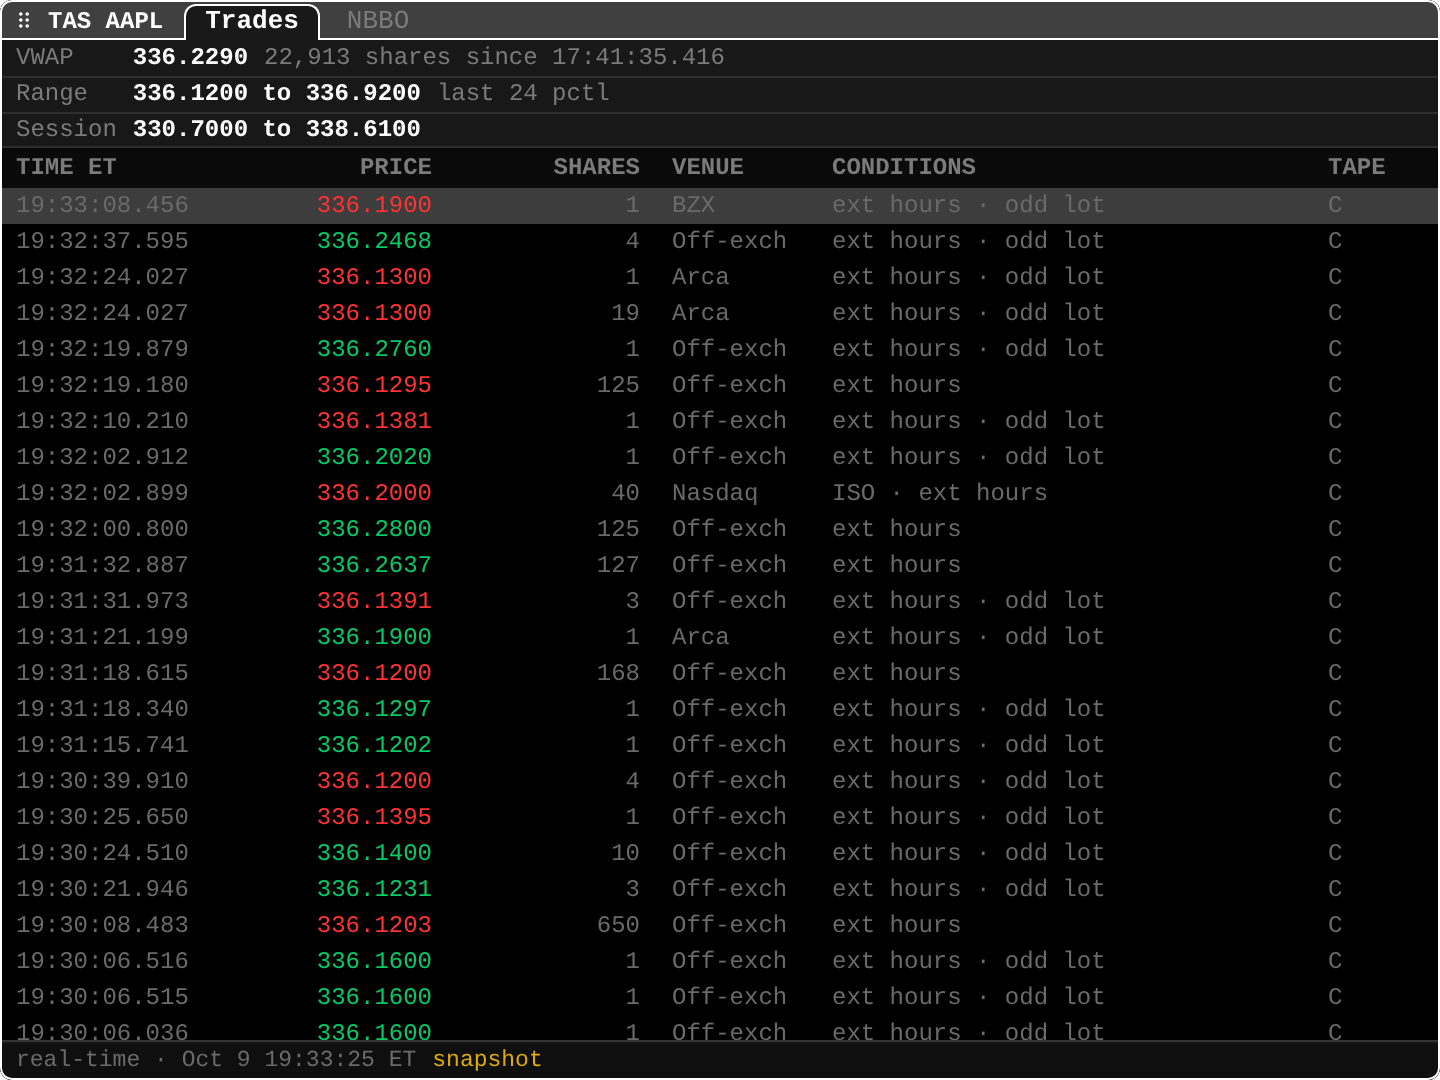
TASTime and sales
Trade-by-trade printsRecent prints from the consolidated tape with time, price, size, venue, and conditions; prints of 10,000 shares or more stand out. US equities, real-time on Pro, 15-minute delayed on Free.
- Example
TAS AAPL - Learn it in the Academy: The trade tape (TAS)
- Example
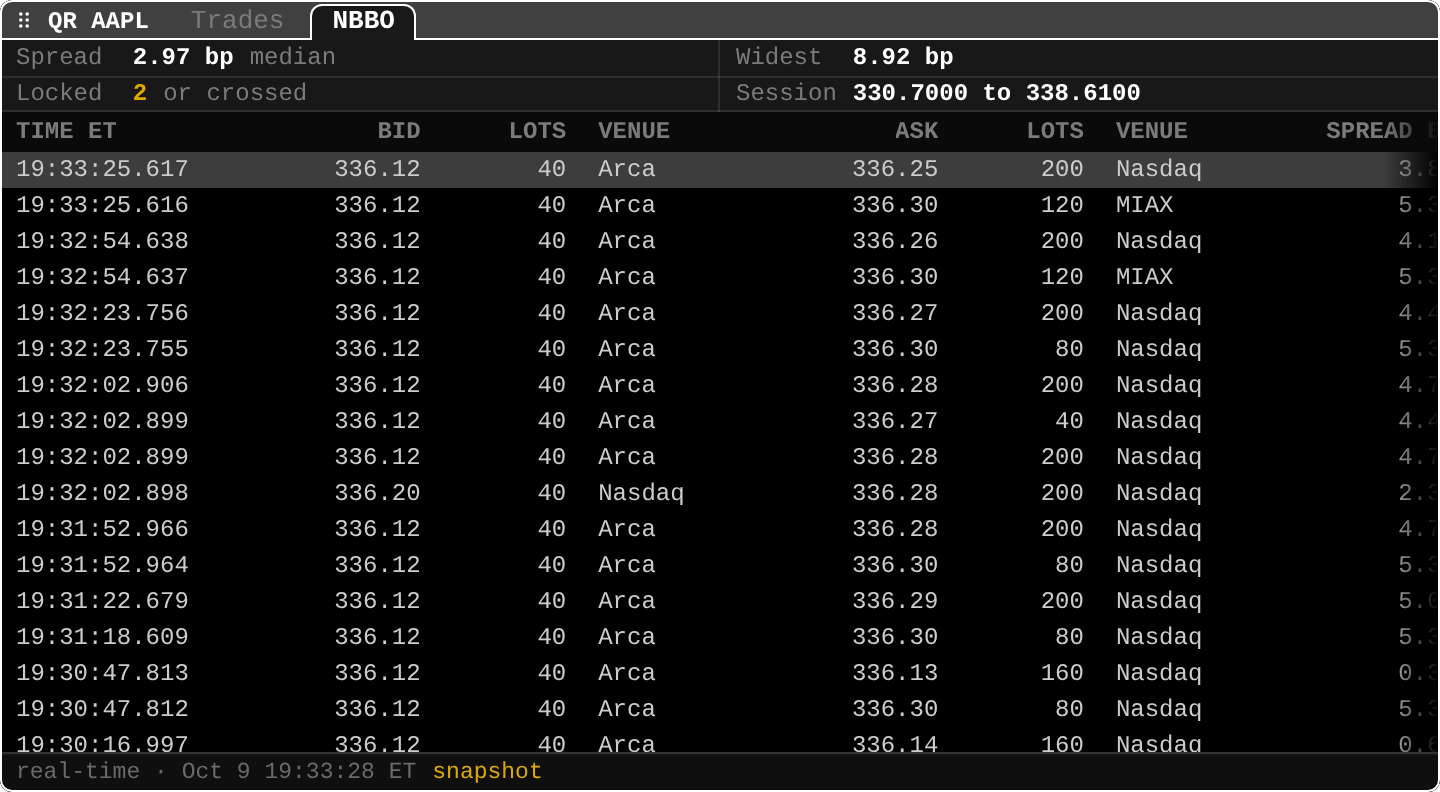
QRQuote recap
NBBO bid and ask historyNBBO history: bid and ask with sizes, venues, and spread in basis points, plus the median and widest spread and locked or crossed quotes. The NBBO tab of TAS.
- Example
QR AAPL - Learn it in the Academy: The best bid and ask over time (QR)
- Example
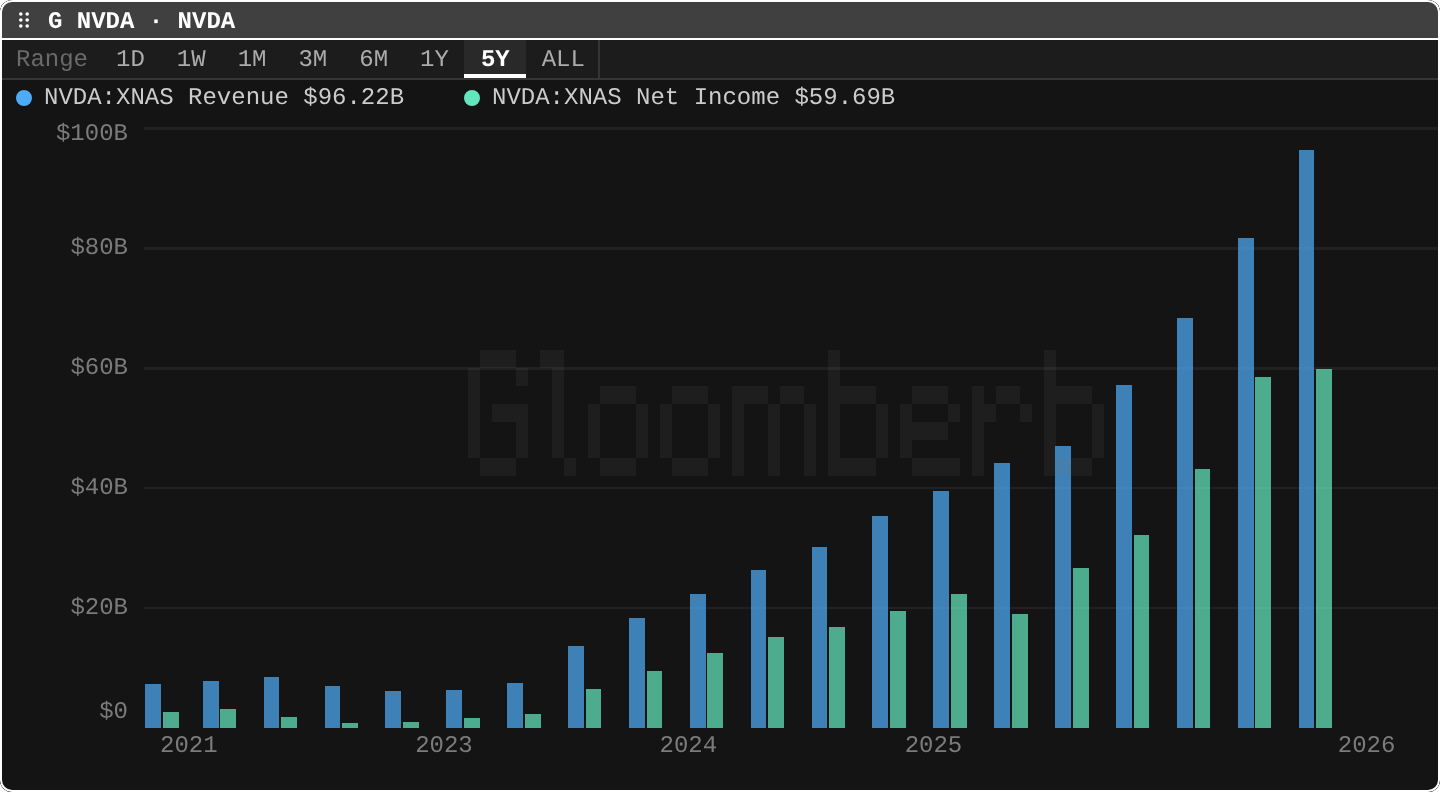
GCustom chart
Chart any series togetherThe chart composer with an explicit series list: prices, statement lines, valuation multiples, FRED series, indicators, and formulas on shared or separate axes. Series read SYMBOL:field or FRED:series, as in NVDA:price, FRED:CPIAUCSL; start empty to search the catalog.
- Example
G NVDA:revenue, NVDA:net_income - Learn it in the Academy: Chart anything together (G)
- Example
CATData catalog
Browse chartable seriesSearches every series the chart composer knows: securities, options, crypto, FRED, treasuries, and futures. Pick one to chart it.
- Example
CAT fed funds
- Example
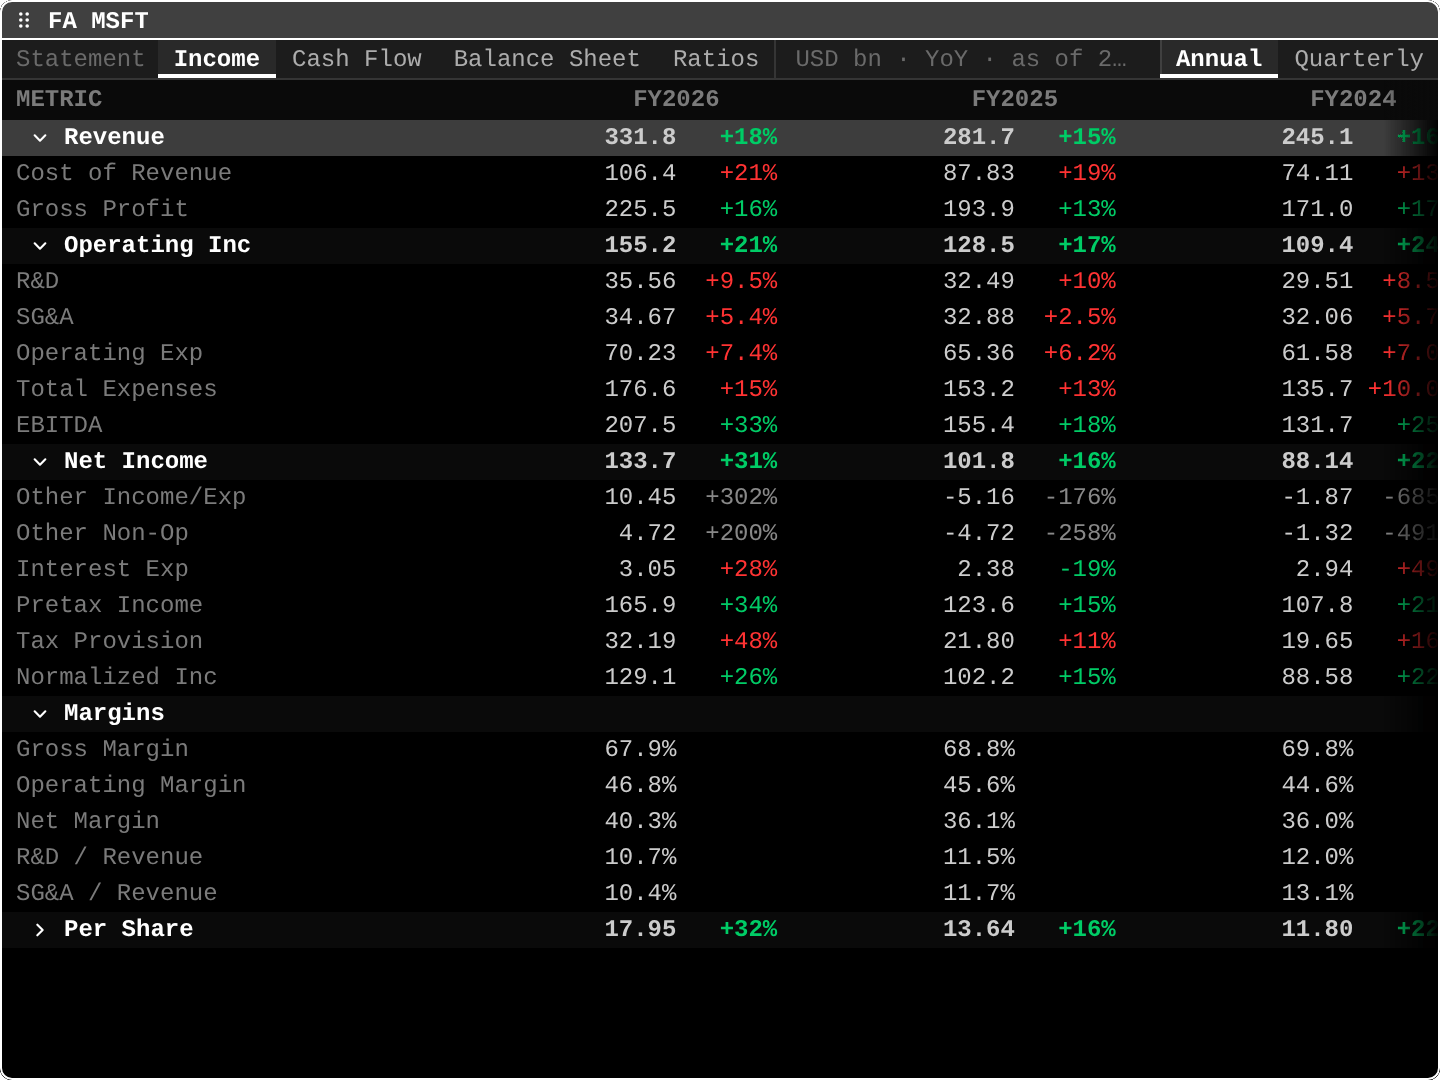
FAFinancial analysis
Income, cash flow, balance sheetAnnual and quarterly statements with the line items you expect, plus derived margins and growth. Switch periods and statements with the tabs.
- Example
FA MSFT - Learn it in the Academy: The three financial statements (FA)
- Example
CRDOCCredit documents
Capital structure and credit termsProInstrument balances, maturities, covenants, change-of-control terms and amendment history with primary-document evidence. Pro includes the full dataset; free access previews three instruments.
COVNCovenants
Covenant headroom and risk screensProMaintenance tests and disclosed financial metrics, with headroom only when contractual definitions and borrower scope match. Screen for low headroom and upcoming springing maturities.
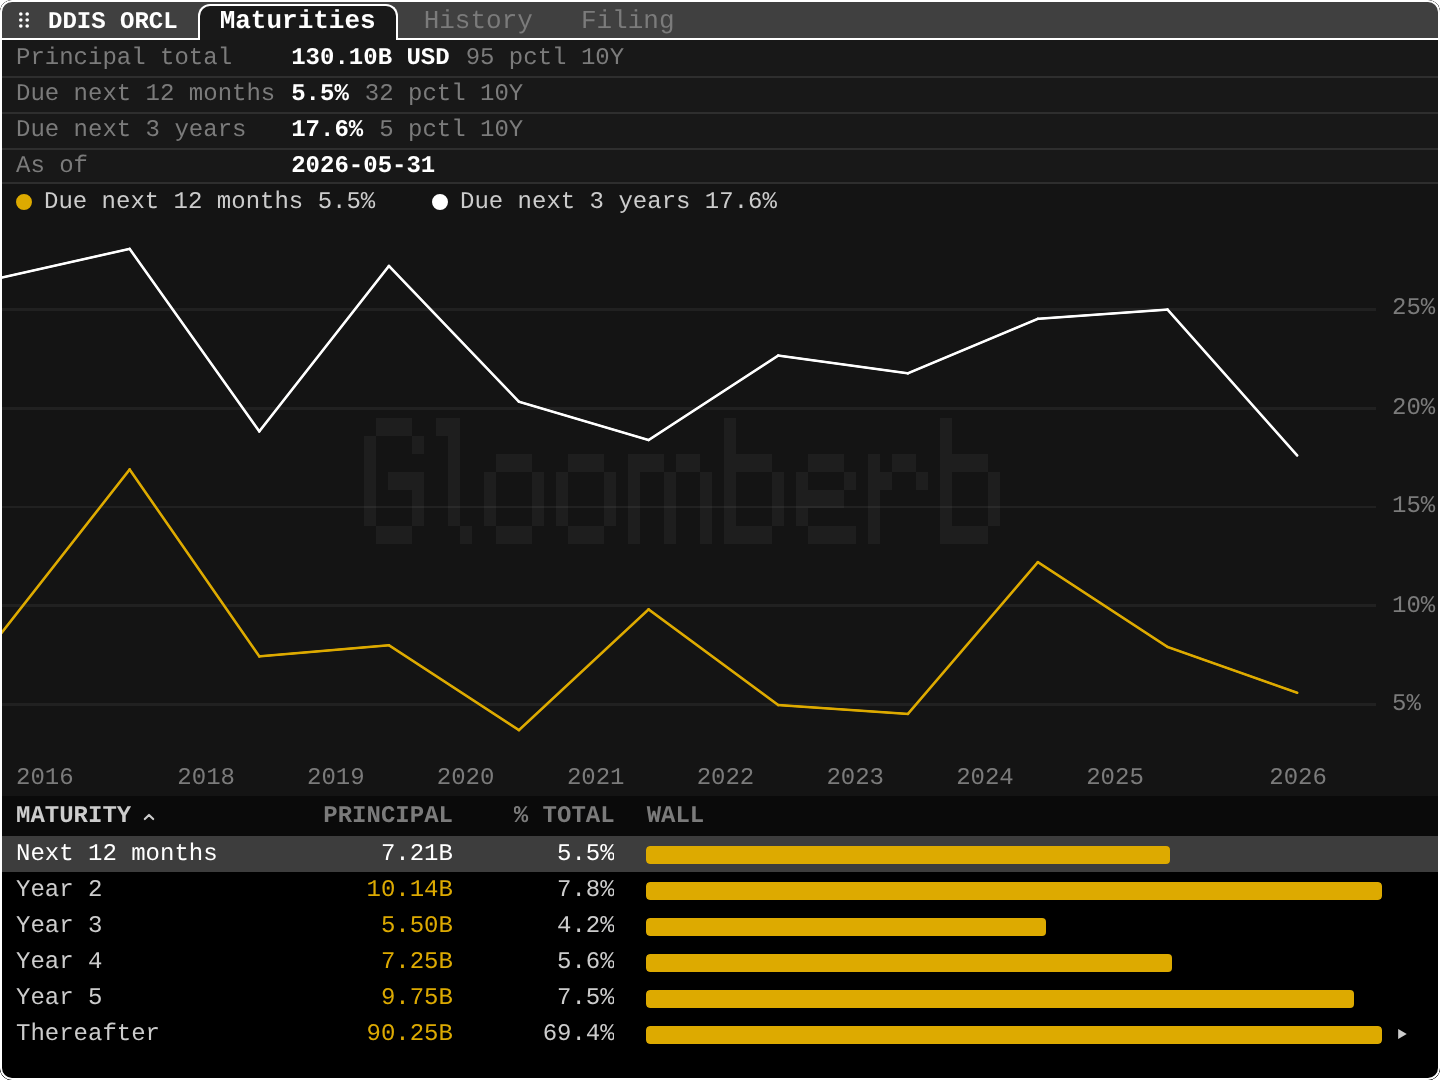
DDISDebt maturities
Principal due by yearPrincipal due in the next 12 months, in each of years two to five, and after, from the latest annual filing, with the near-term share ranked against 10 years. A newer 10-Q adds its current and non-current debt. History tracks principal and interest expense.
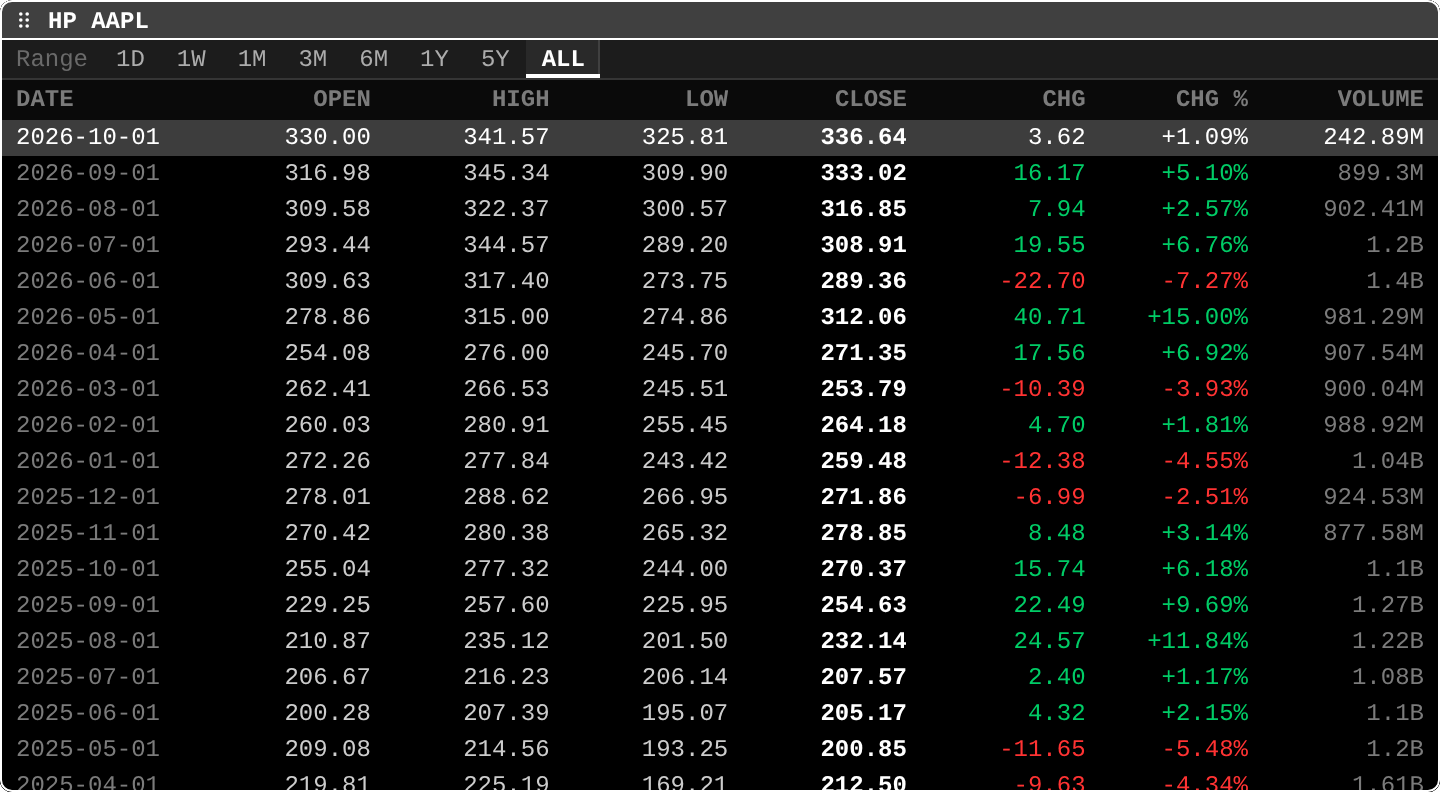
HPHistorical prices
OHLCV tableDaily open, high, low, close, and volume in a scrollable table, exportable to CSV from pane settings.
- Example
HP AAPL - Learn it in the Academy: The price history table (HP)
- Example
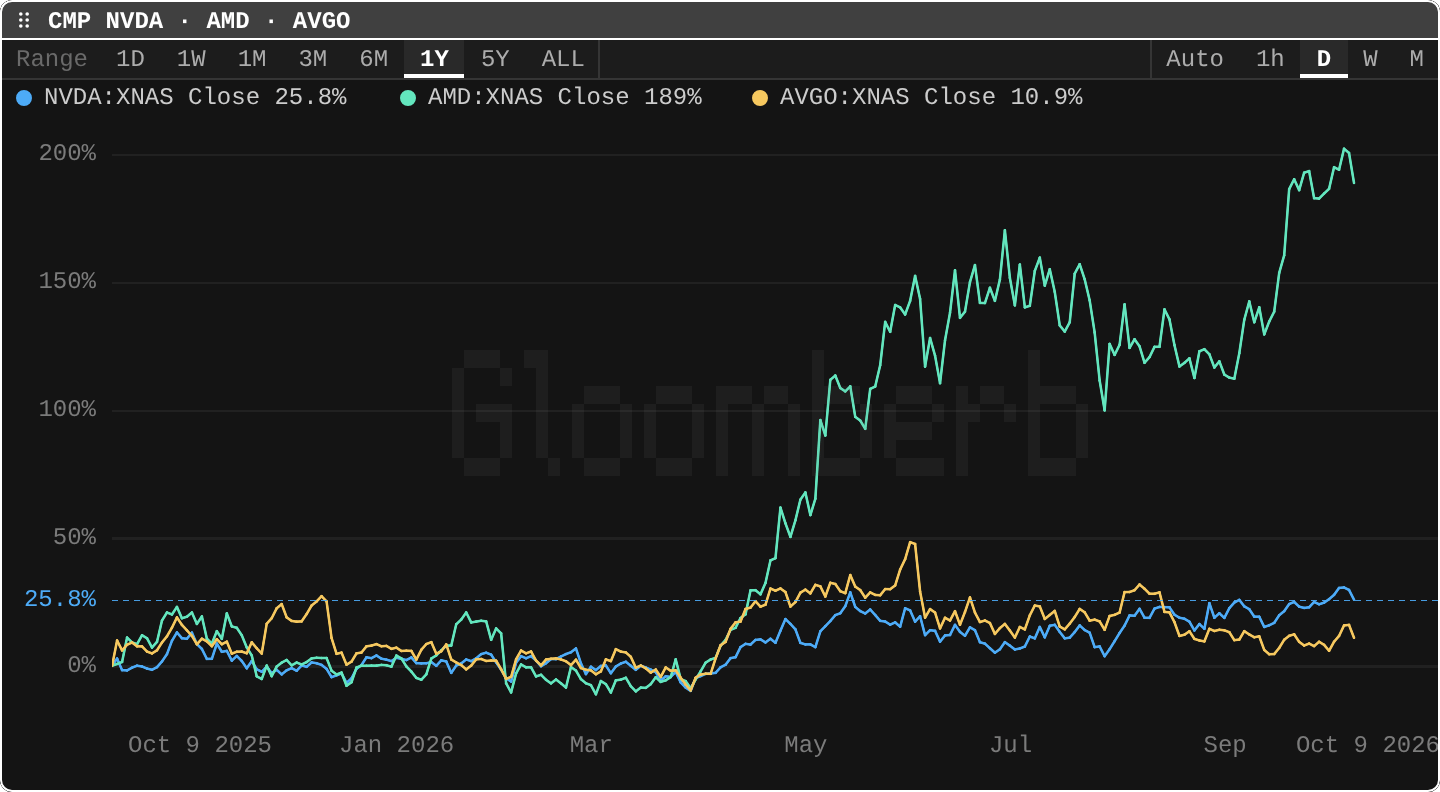
CMPCompare performance
Indexed returns for a groupPrice returns rebased to a shared start date for two or more tickers, so relative performance is readable at a glance.
- Example
CMP NVDA, AMD, AVGO - Learn it in the Academy: Comparing returns (CMP)
- Example
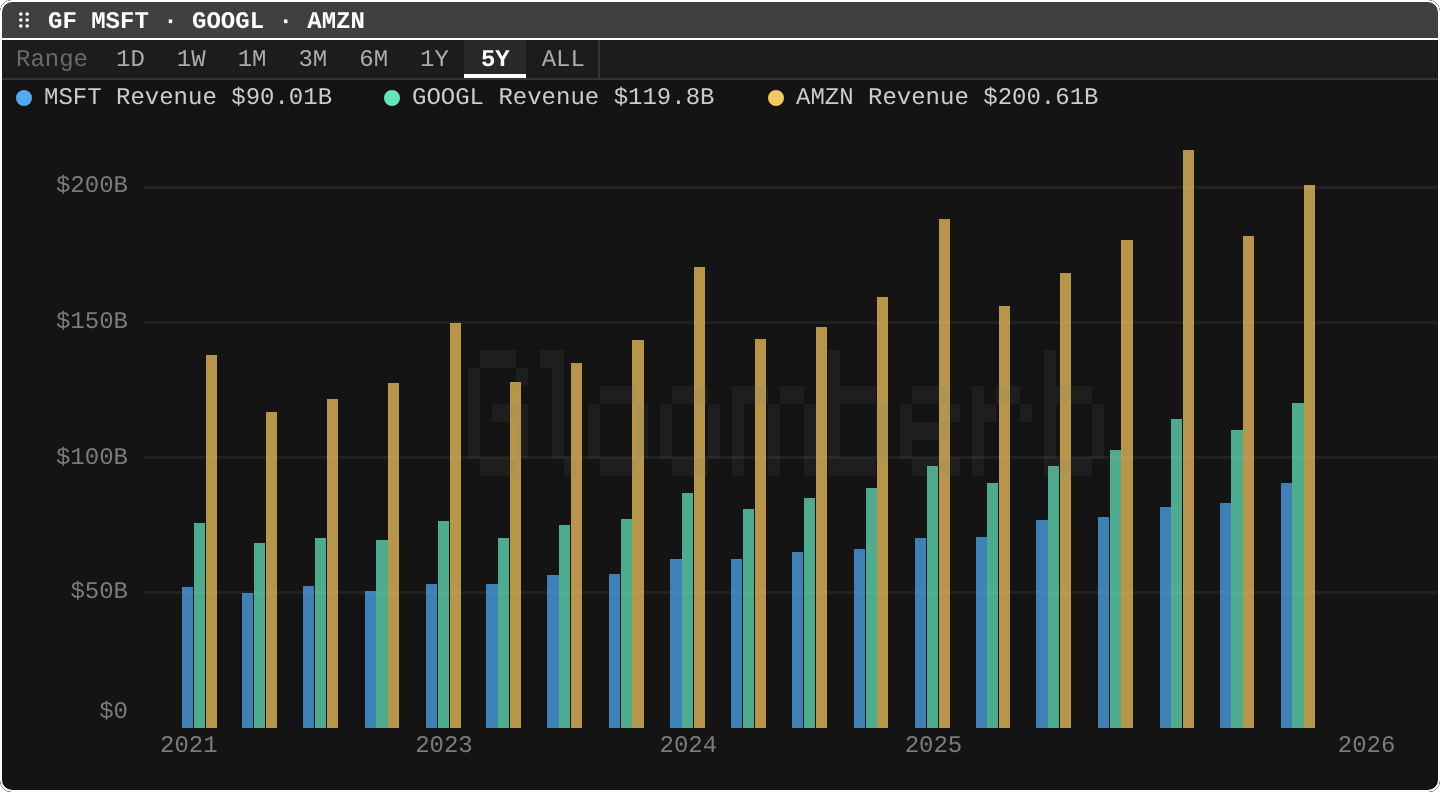
GFFundamental graph
Revenue across tickersQuarterly revenue for one or more companies as grouped columns, with any other statement field one click away in the series editor.
- Example
GF MSFT, GOOGL, AMZN - Learn it in the Academy: Valuation over time (GE, GF, PEB)
- Example
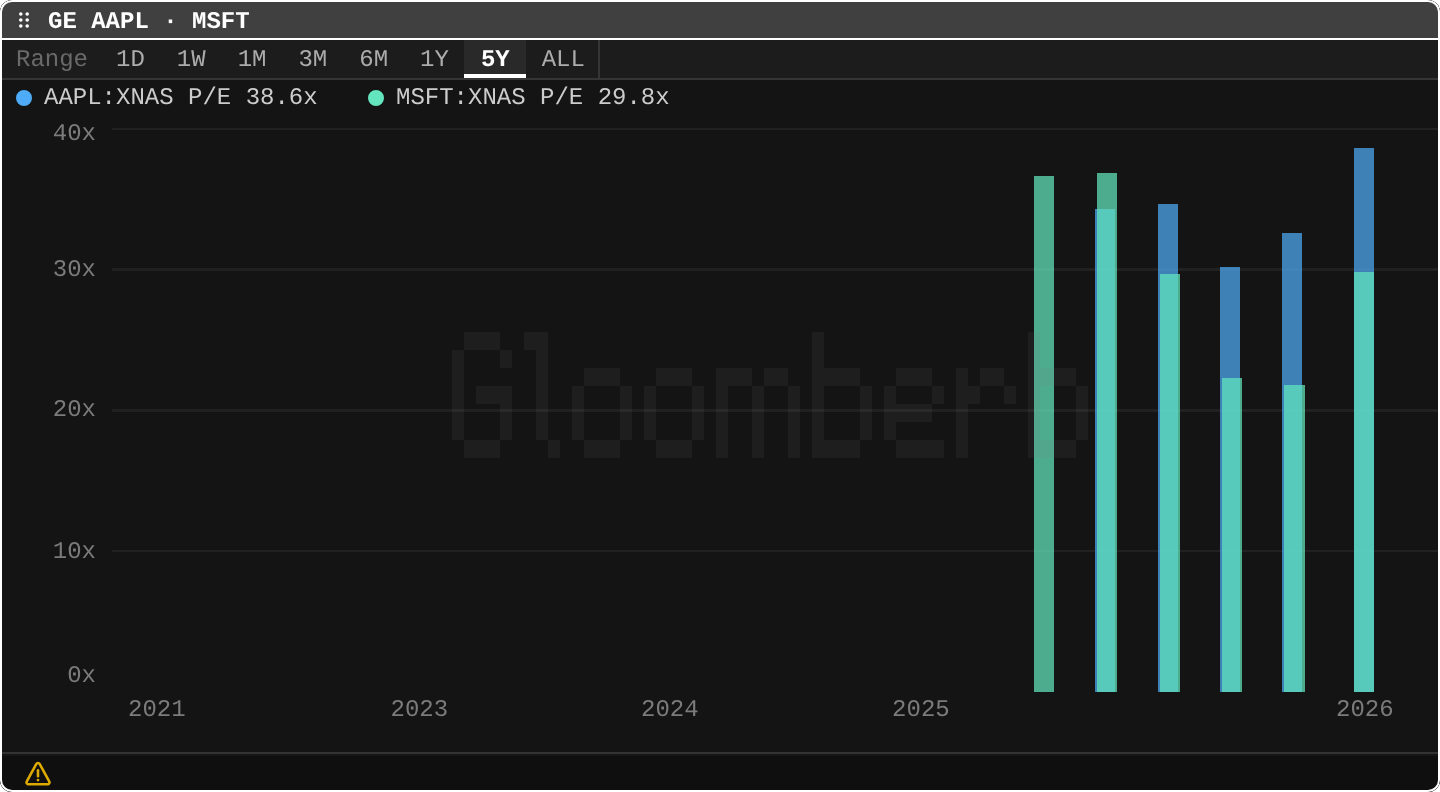
GEValuation graph
Trailing P/E across tickersTrailing P/E history for one or more tickers; switch to forward P/E, PEG, P/S, EV/EBITDA, or P/FCF in the series editor.
- Example
GE AAPL, MSFT - Learn it in the Academy: Valuation over time (GE, GF, PEB)
- Example
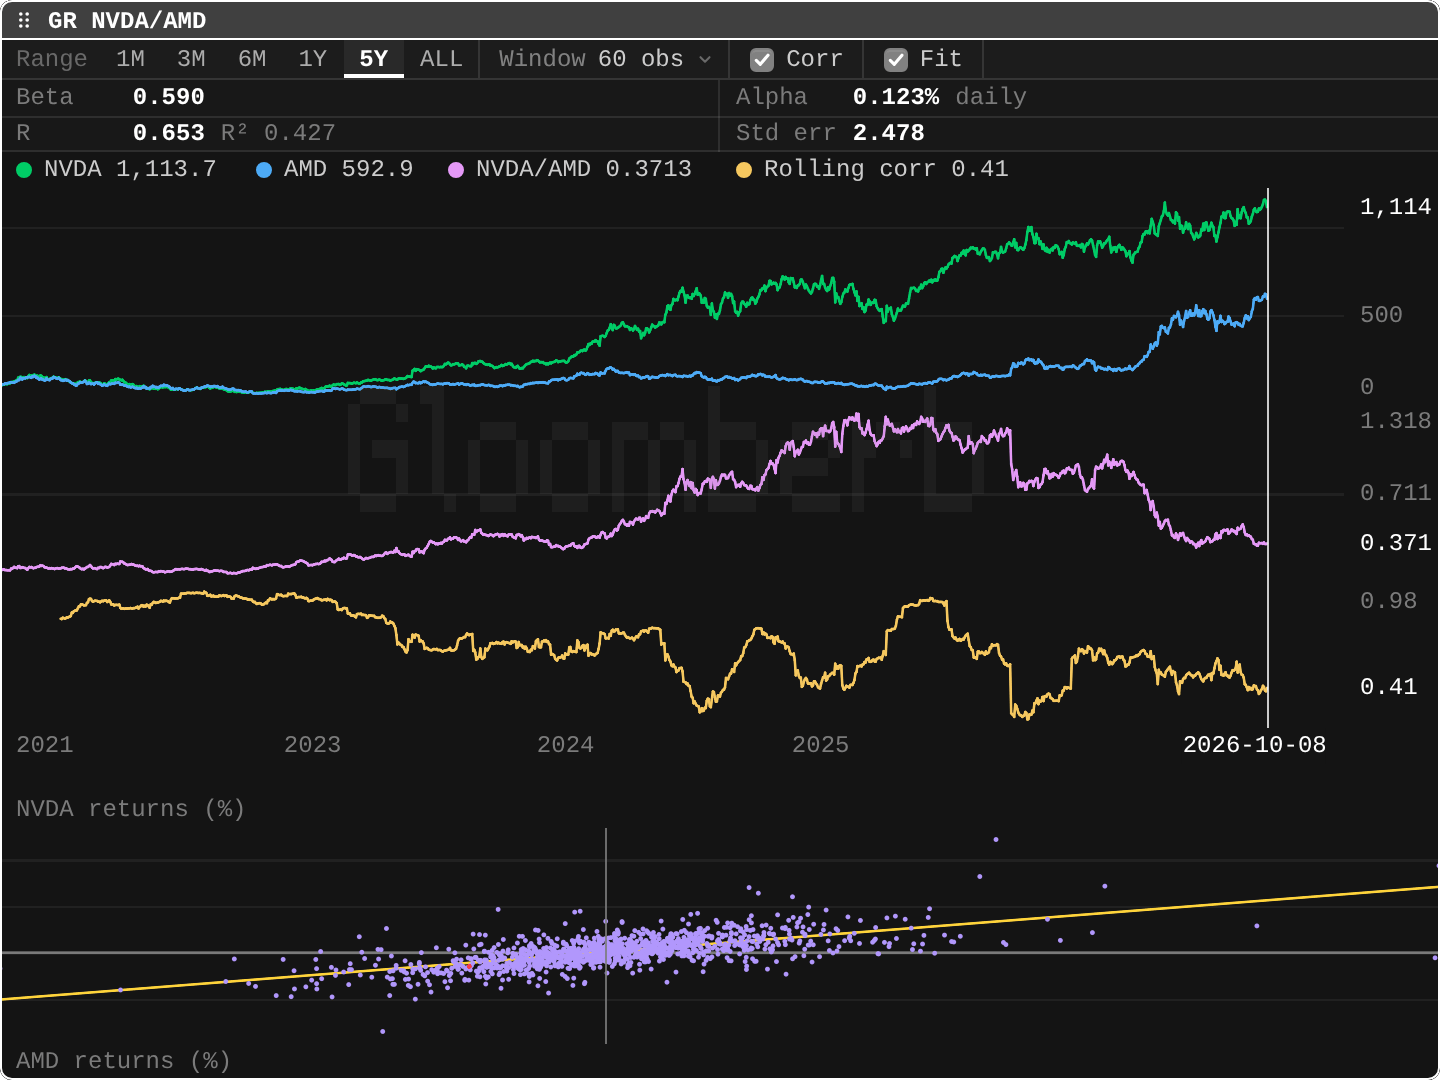
GRRelationship graph
Ratio, correlation, regressionHow two tickers move together: indexed prices, their ratio, rolling correlation, and a return regression with beta, alpha, and R².
- Example
GR NVDA, AMD - Learn it in the Academy: How stocks move together (GR, CORR)
- Example
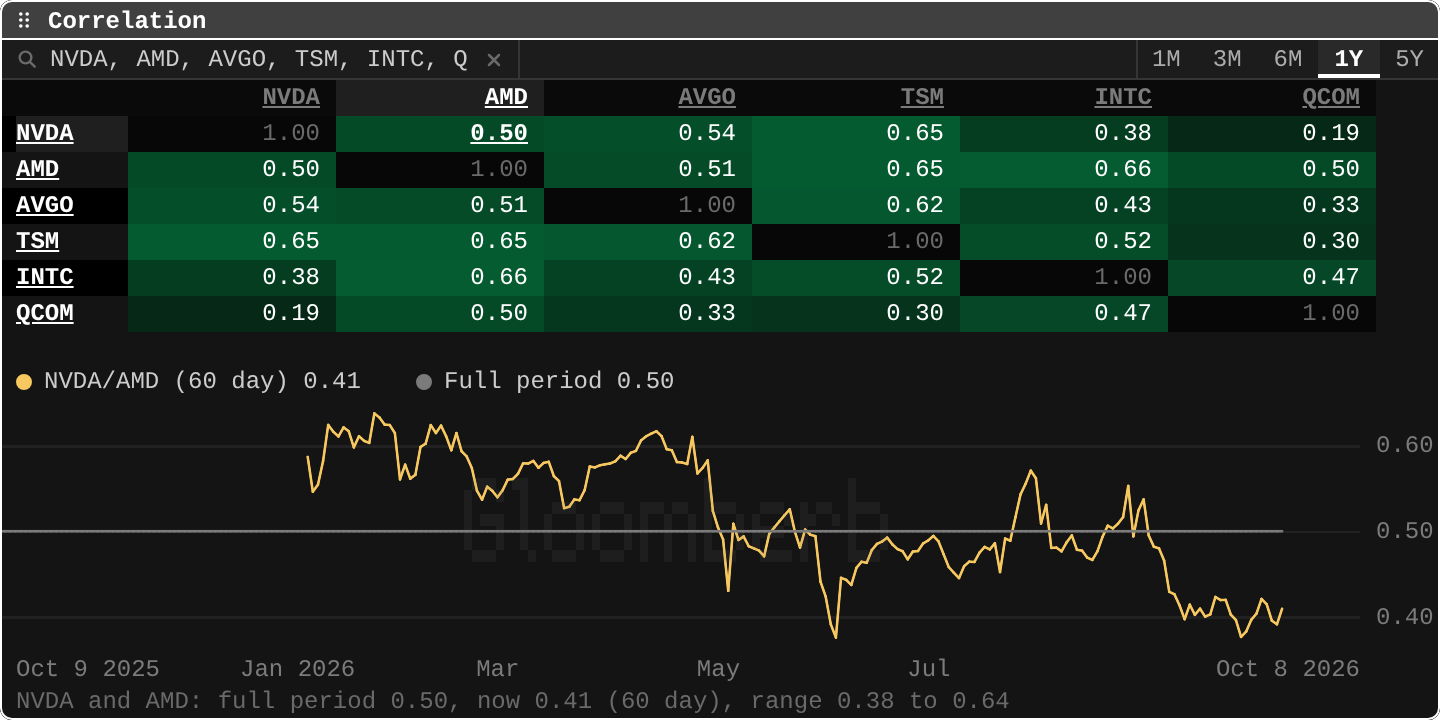
CORRCorrelation matrix
Pairwise return correlationsA date-aligned Pearson correlation matrix of daily returns for a basket, useful for checking how diversified a set of names really is.
- Example
CORR NVDA, AMD, AVGO, TSM - Learn it in the Academy: How stocks move together (GR, CORR)
- Example
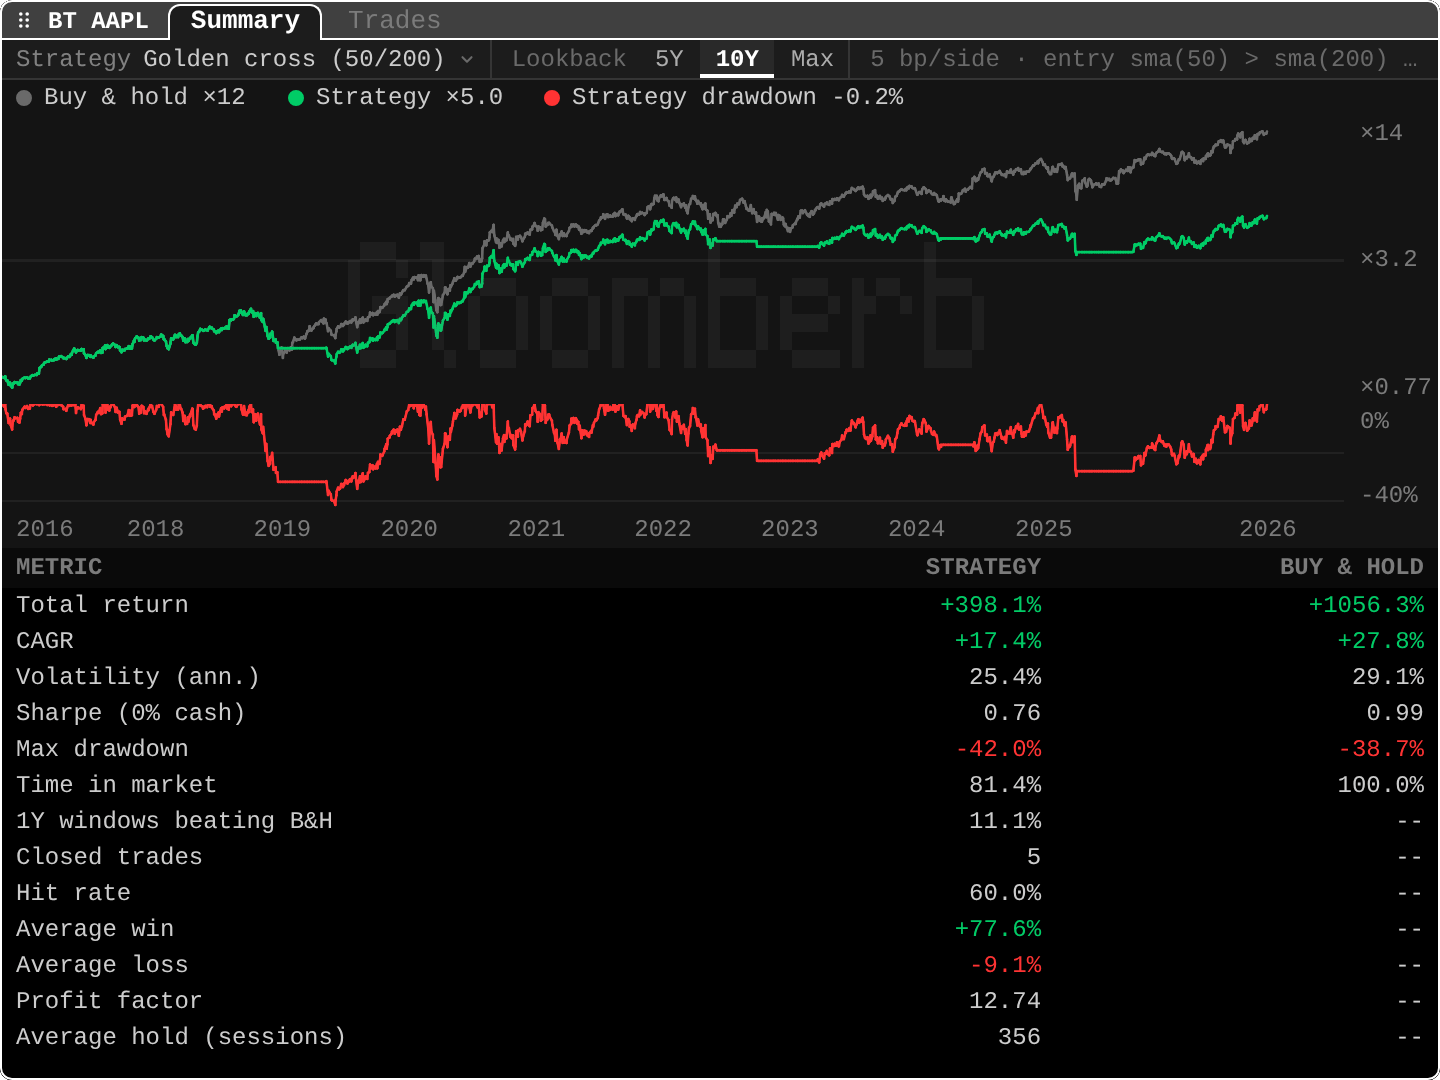
BTBacktest
Indicator rule vs buy-and-holdTests a long-only rule on daily history against buy-and-hold: a preset like golden cross or RSI, or your own, like rsi(14) < 30. Equity and drawdown curves, CAGR, Sharpe, and every trade. BTST opens it too.
- Example
BT AAPL - Learn it in the Academy: Backtesting a rule (BT, BTST)
- Example
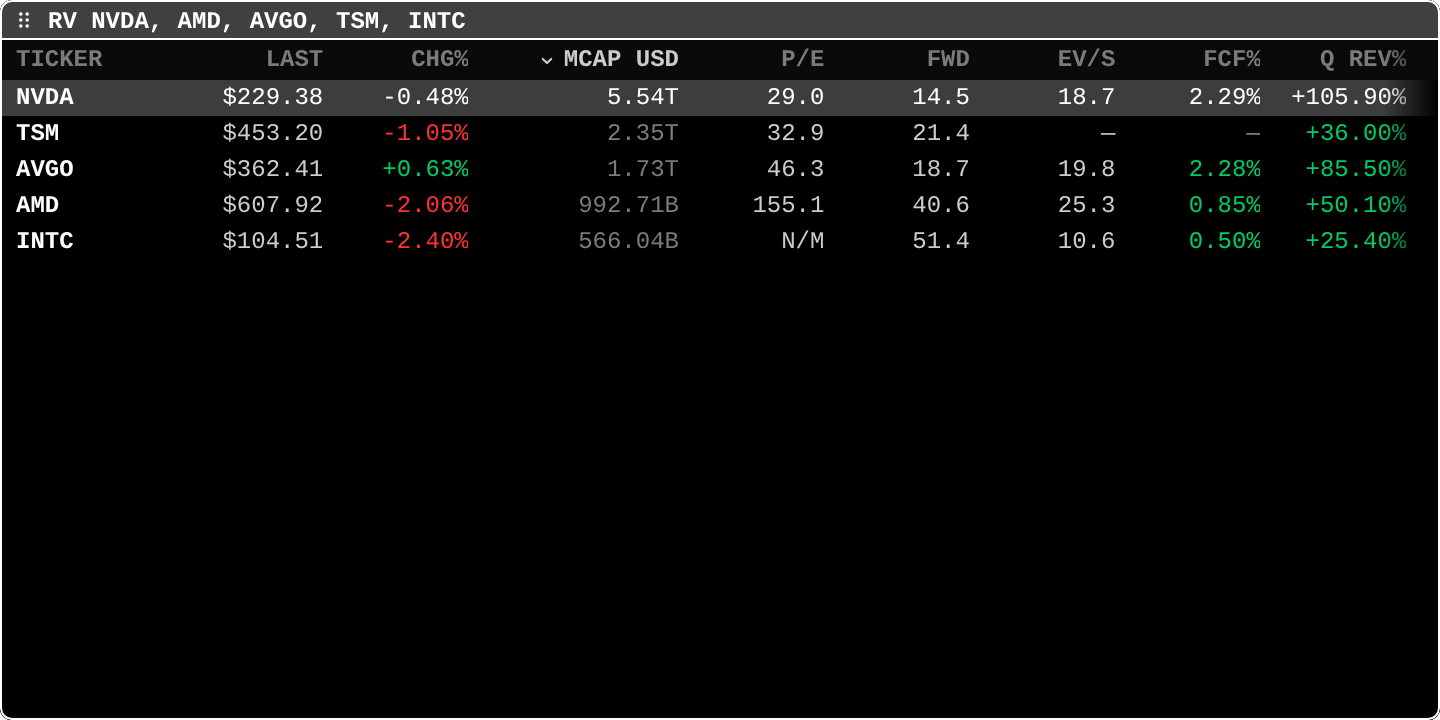
RVRelative valuation
Multiples across peersValuation and operating metrics for a peer group in one table: market cap, P/E, EV/EBITDA, margins, growth, and more.
- Example
RV NVDA, AMD, AVGO - Learn it in the Academy: Relative valuation (RV)
- Example
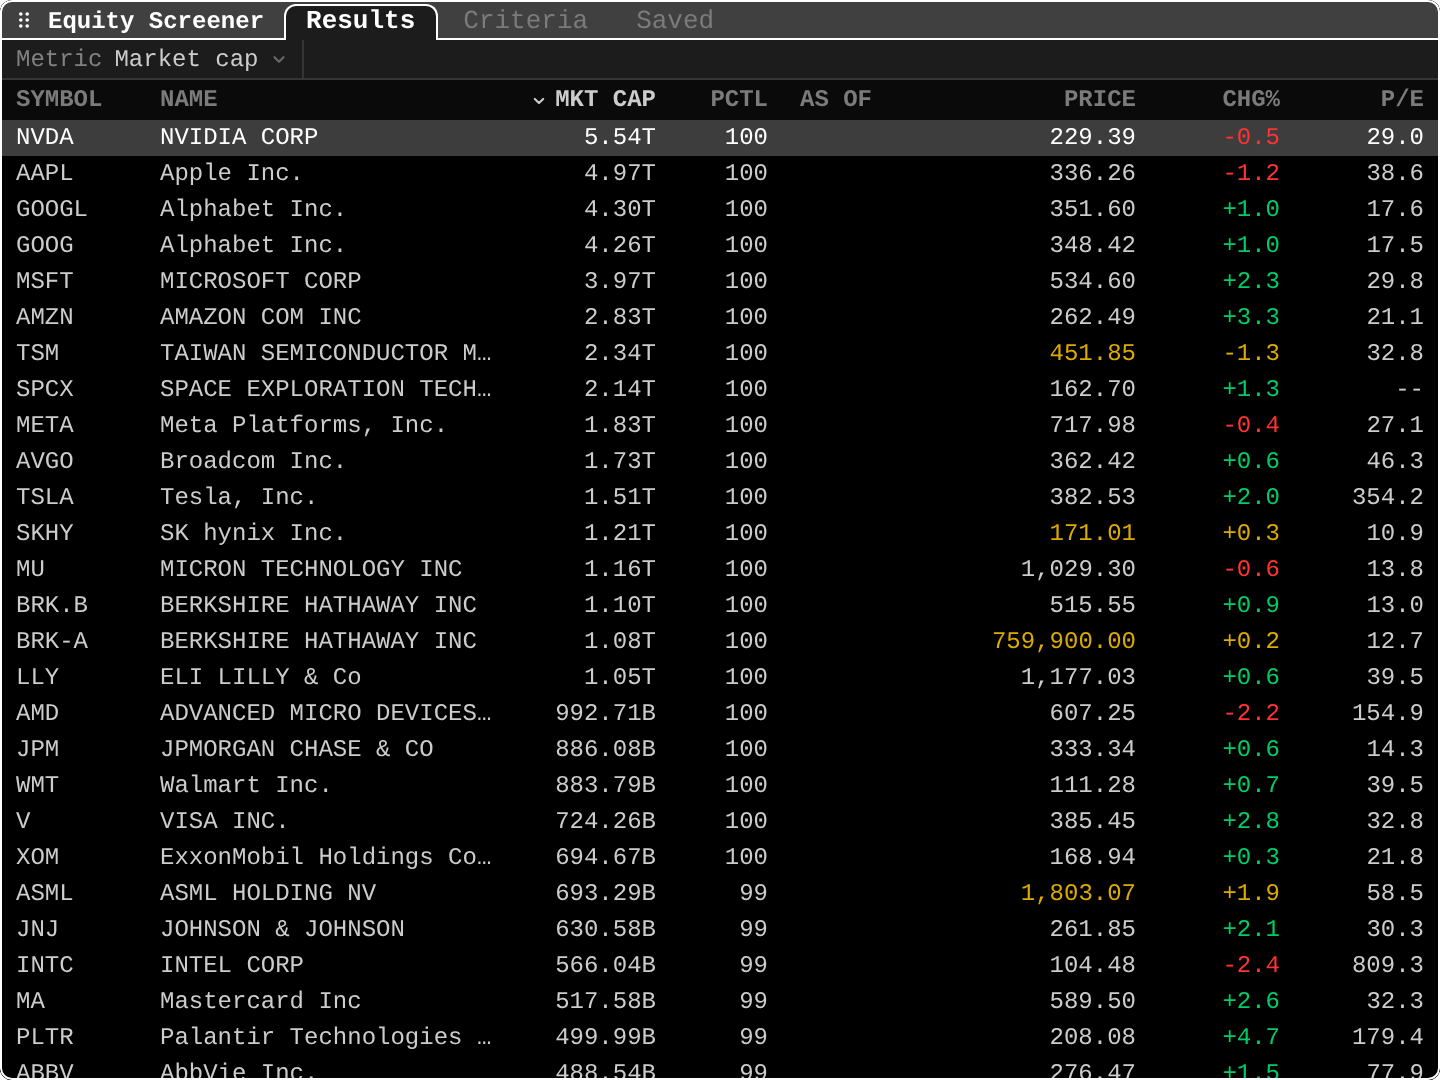
EQSEquity screener
Screen stocks by criteriaFilter covered stocks on valuation, growth, margins, liquidity, short interest, insider activity, and 13F holders, then rank the matches by any metric. Exports to CSV; saving a screen needs a verified email.
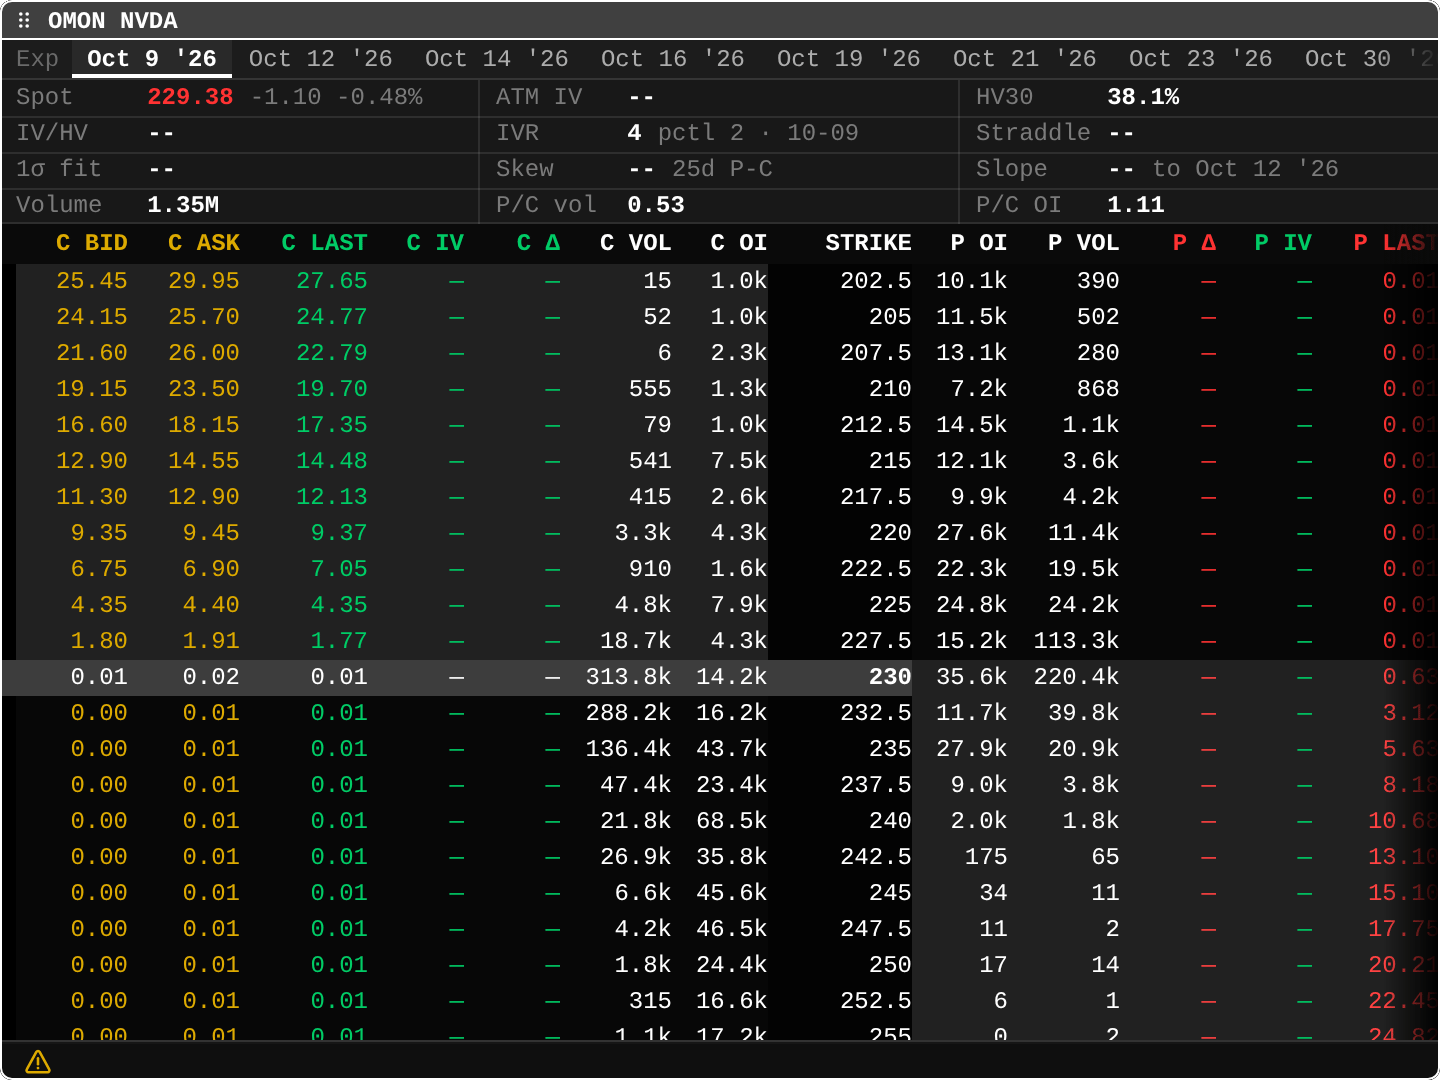
OMONOptions monitor
Options chainCalls and puts by expiry with bid, ask, volume, open interest, implied volatility, and Greeks. Real-time on Pro.
- Example
OMON NVDA - Learn it in the Academy: The options chain (OMON)
- Example
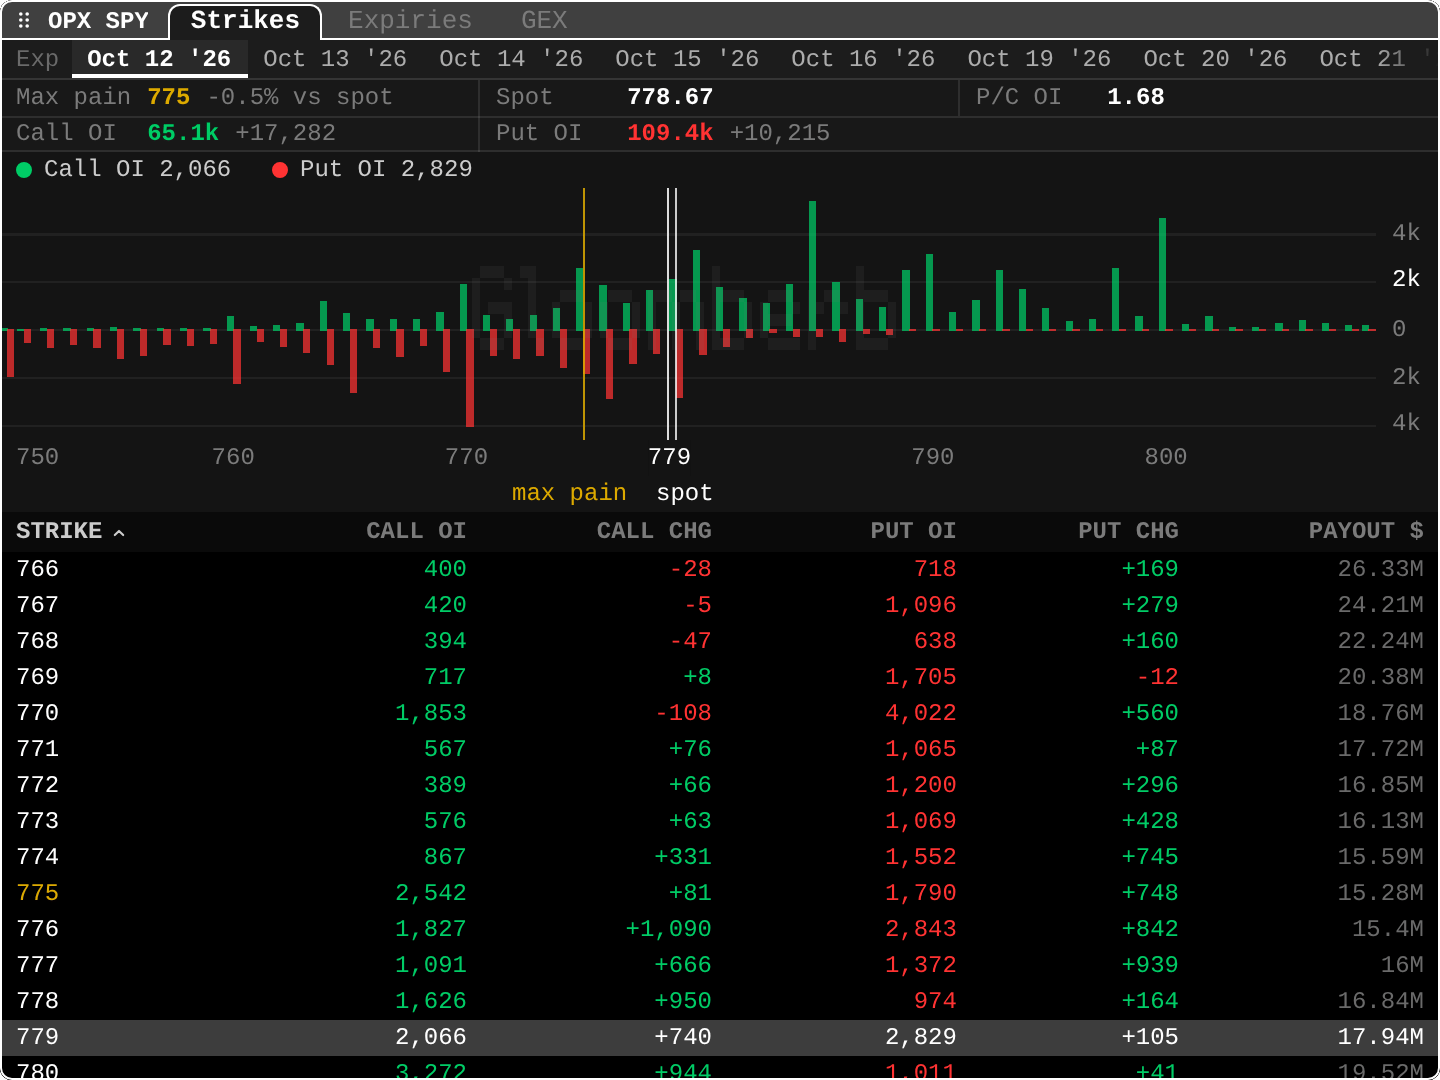
OPXOptions positioning
Open interest, max pain, gammaOpen interest by strike with max pain, each expiry's put/call ratio and net dealer gamma, and dealer gamma by strike with its flip level and call and put walls. Open interest is about two sessions old; the footer names its date. GEX and MAXPAIN open it too.
- Example
OPX SPY - Learn it in the Academy: Open interest and max pain (OPX)
- Example
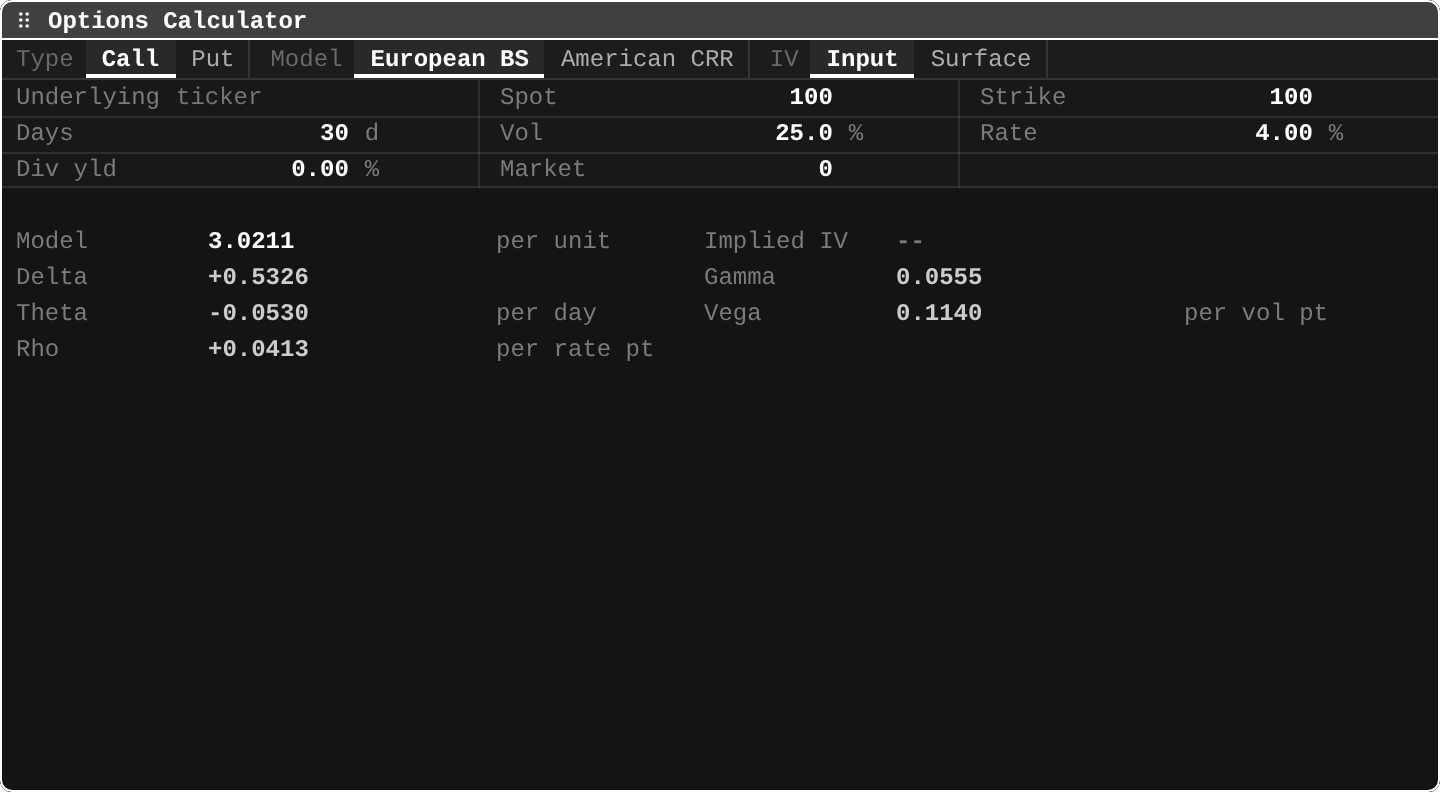
OVMEOptions calculator
Black-Scholes and GreeksPrice a European call or put from spot, strike, rate, volatility, and expiry, or solve for implied volatility from a market price.
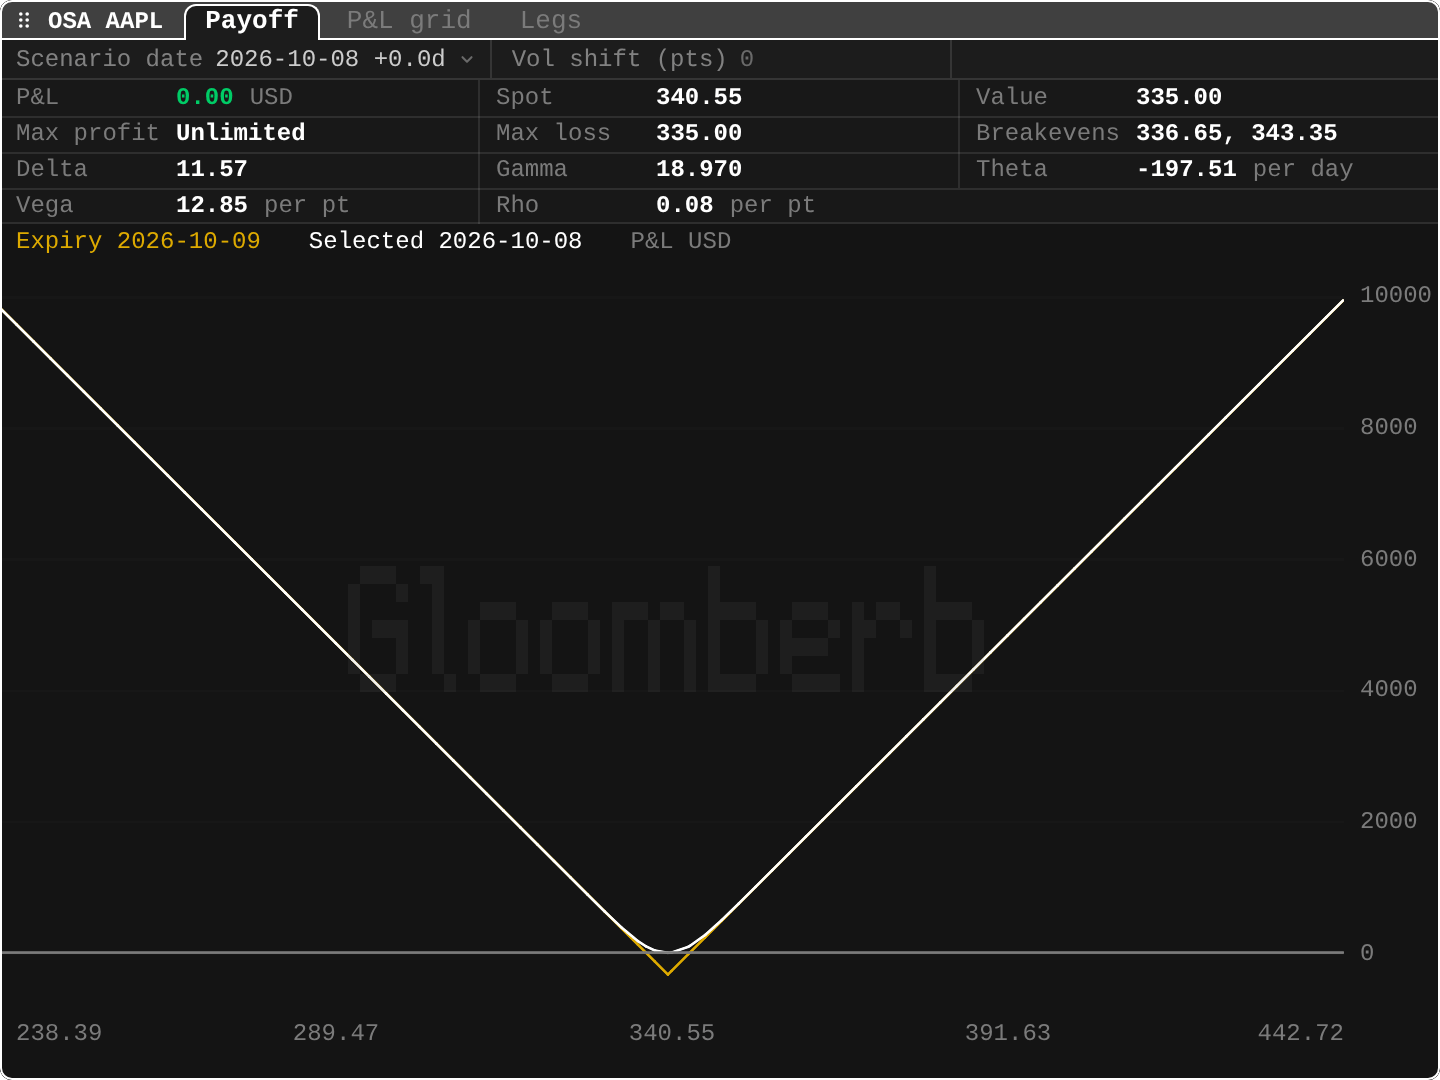
OSAOptions scenario
Multi-leg payoff and P&LBuild a multi-leg options position from the chain, from OMON, or by hand, and value it at any spot, date, and vol shift: payoff, P&L grid, breakevens, and Greeks. It also sells a cash-secured put, with the yield on cash at the mid and at the bid, sizes a protective put to a hedge budget, and collars shares. European pricing, so no early exercise.
- Example
OSA AAPL - Learn it in the Academy: Building a position (OSA)
- Example
CSPOptions strategy screen
Puts, covered calls, spreads, condors, straddles and calendars across a listOne tab per strategy: cash-secured put, covered call, vertical, iron condor, straddle, strangle and calendar. For each ticker it picks the legs by delta and expiry, then shows credit or debit, max gain and loss, break-evens, probability of profit, IV rank, wide spreads and earnings before expiry. Income trades rank by yearly return, debit trades by reward to risk.
- Example
CSP JPM, GS, KO
- Example
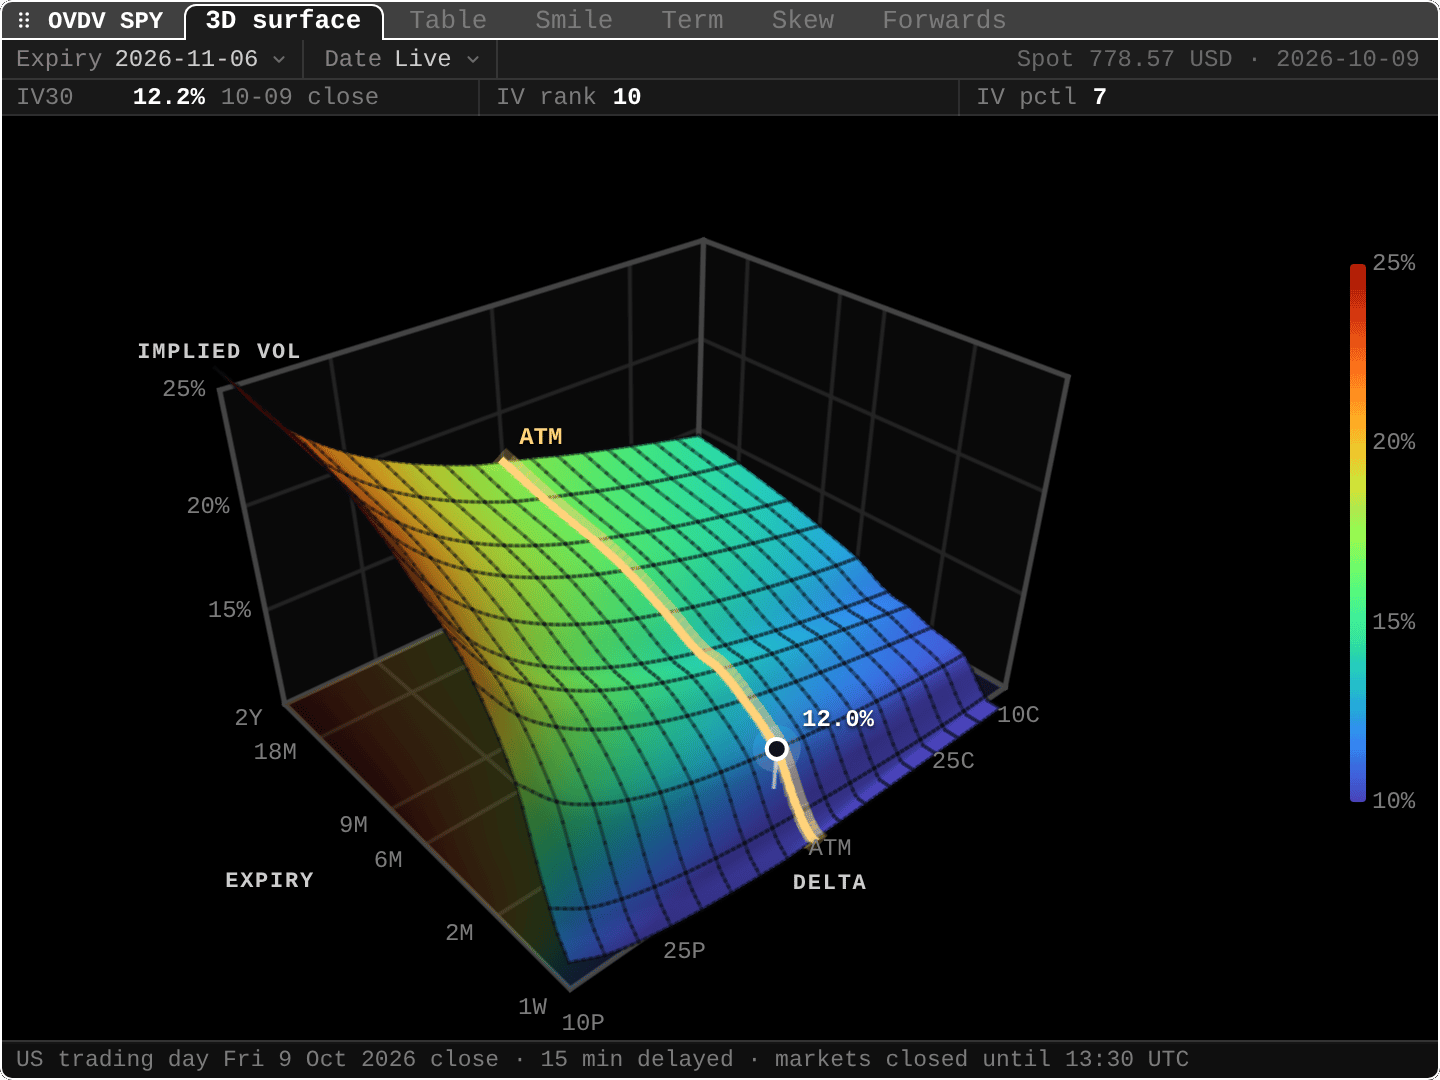
OVDVVolatility surface
Implied vol surface and skewThe implied volatility surface fitted from option quotes: 3D sheet, table, smiles, ATM term structure, 25-delta skew, and forwards. Steps back through stored daily closes; live is real-time on Pro, 15-minute delayed on Free.
- Example
OVDV NVDA - Learn it in the Academy: The volatility surface and skew (OVDV)
- Example
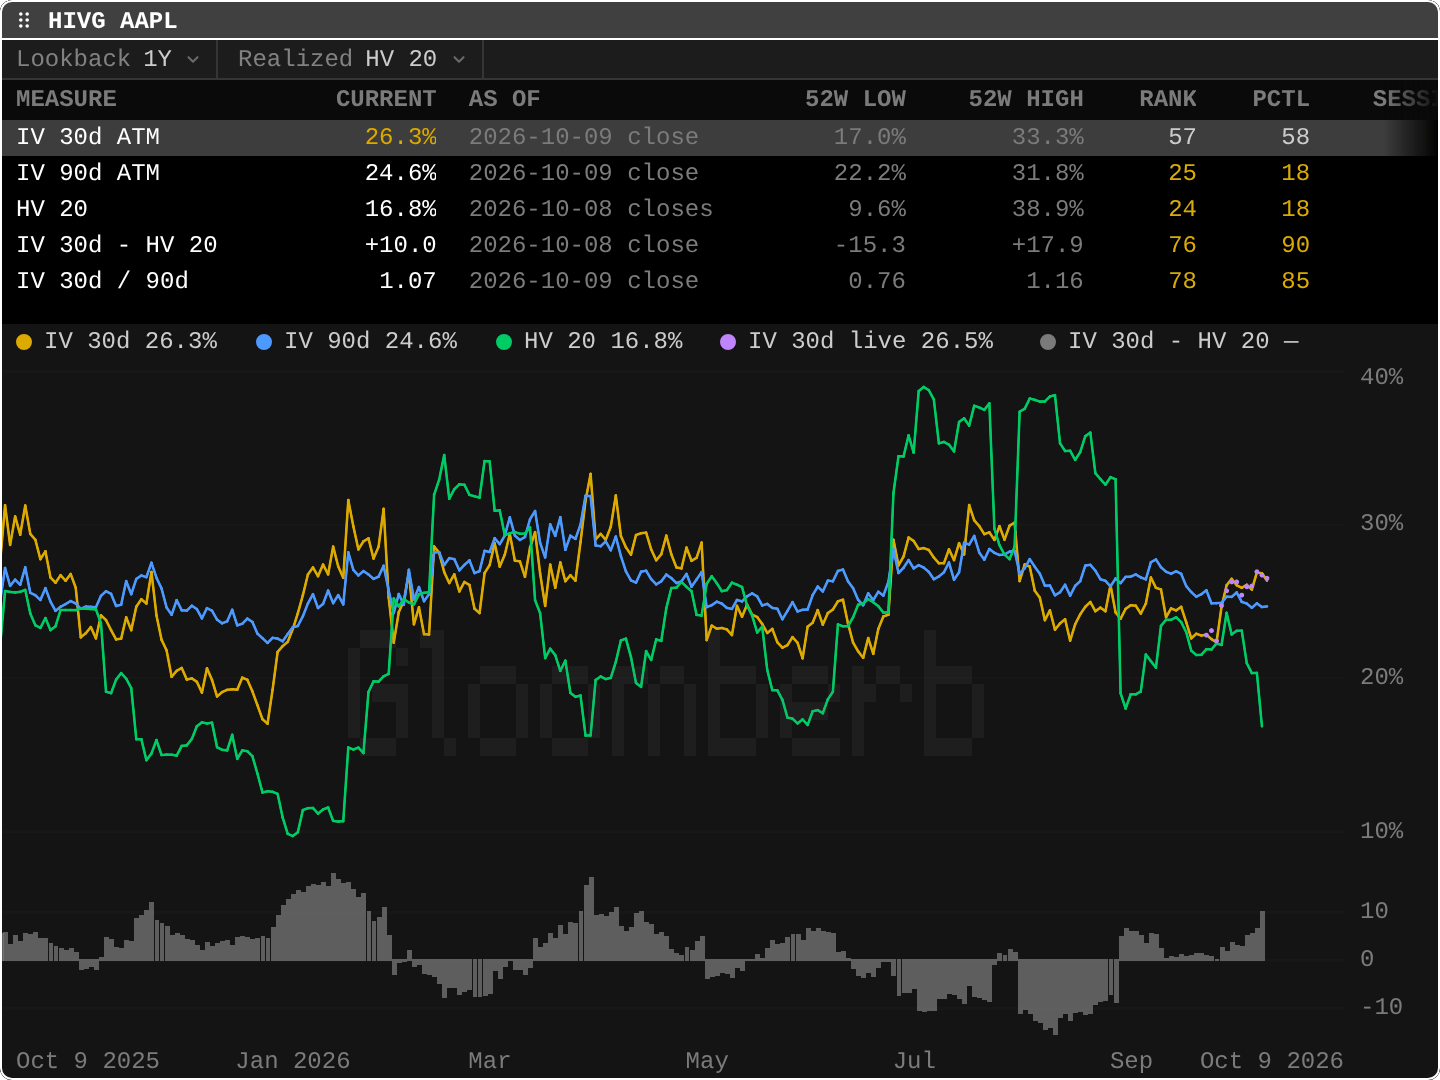
HIVGImplied volatility history
IV vs realized, IV rankDaily 30- and 90-day at-the-money implied vol since February 2024 against realized vol, with the spread and each measure's 52-week rank and percentile. A new ticker backfills in a few minutes.
- Example
HIVG AAPL - Learn it in the Academy: Is implied vol high or low? (HIVG, VCA)
- Example
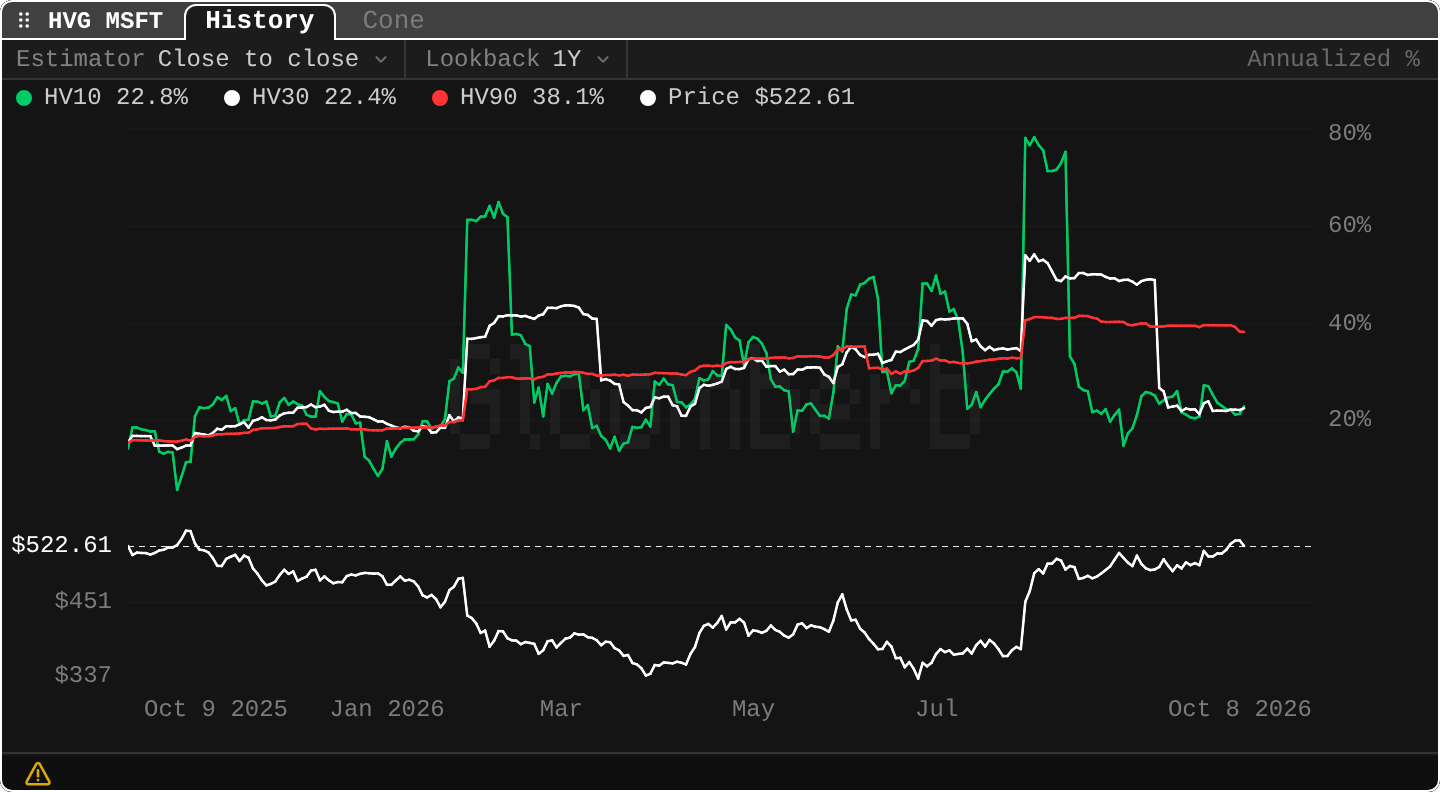
HVGRealized volatility
Rolling realized vol graphRolling realized volatility over windows from 10 to 260 sessions, with price and today's at-the-money IV for reference. Five estimators, from close-to-close to Yang-Zhang.
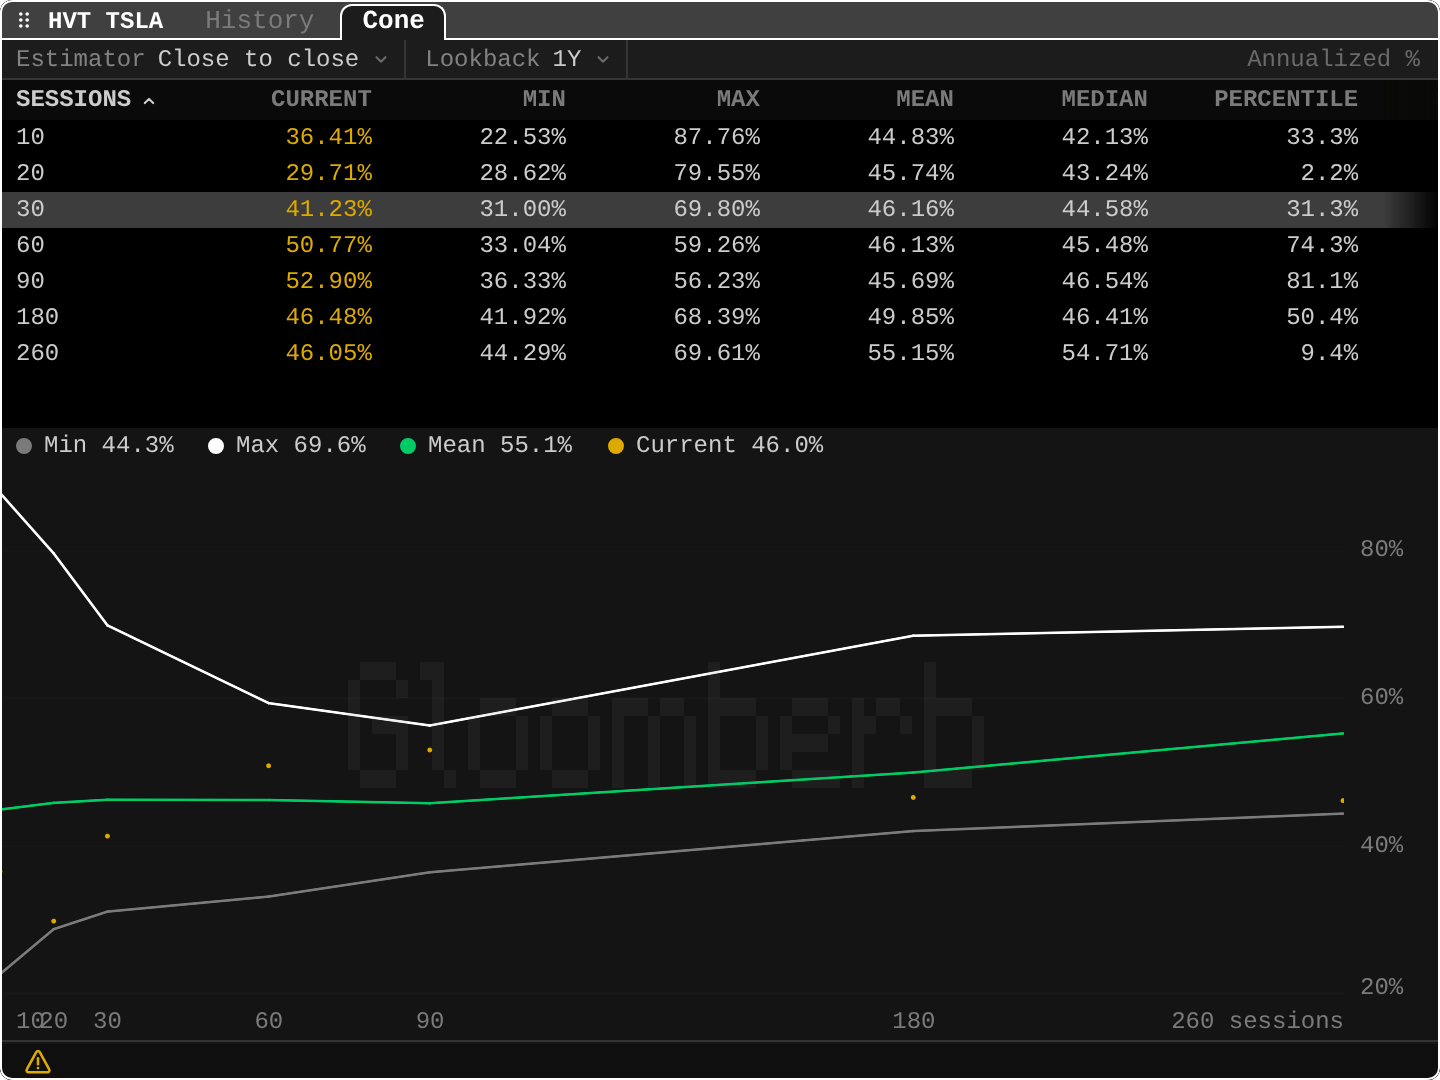
HVTVolatility cone
Realized vol vs its rangeEach window's realized volatility against its one- or two-year range, as a cone and a table, with today's at-the-money IV on top: is vol high for this name? The Cone tab of HVG.
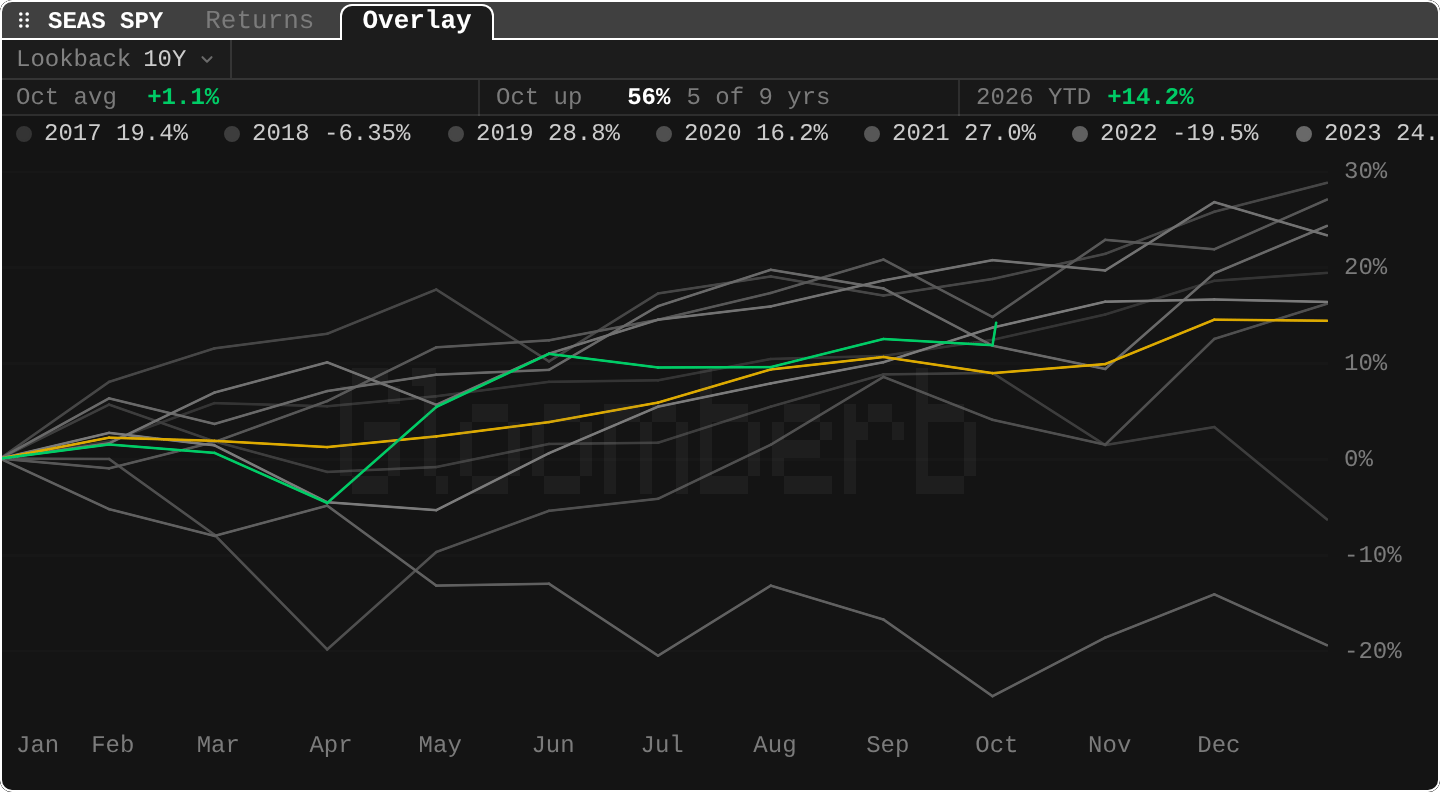
SEASSeasonality
Monthly returns and calendar patternsMonthly returns for each year as a heatmap, every month's average, median and share of up years, each year's path laid over one January-to-December axis, and a Weekdays tab with the average return, up share and session count for each weekday and the turn of the month.
- Example
SEAS SPY - Learn it in the Academy: Seasonality (SEAS)
- Example
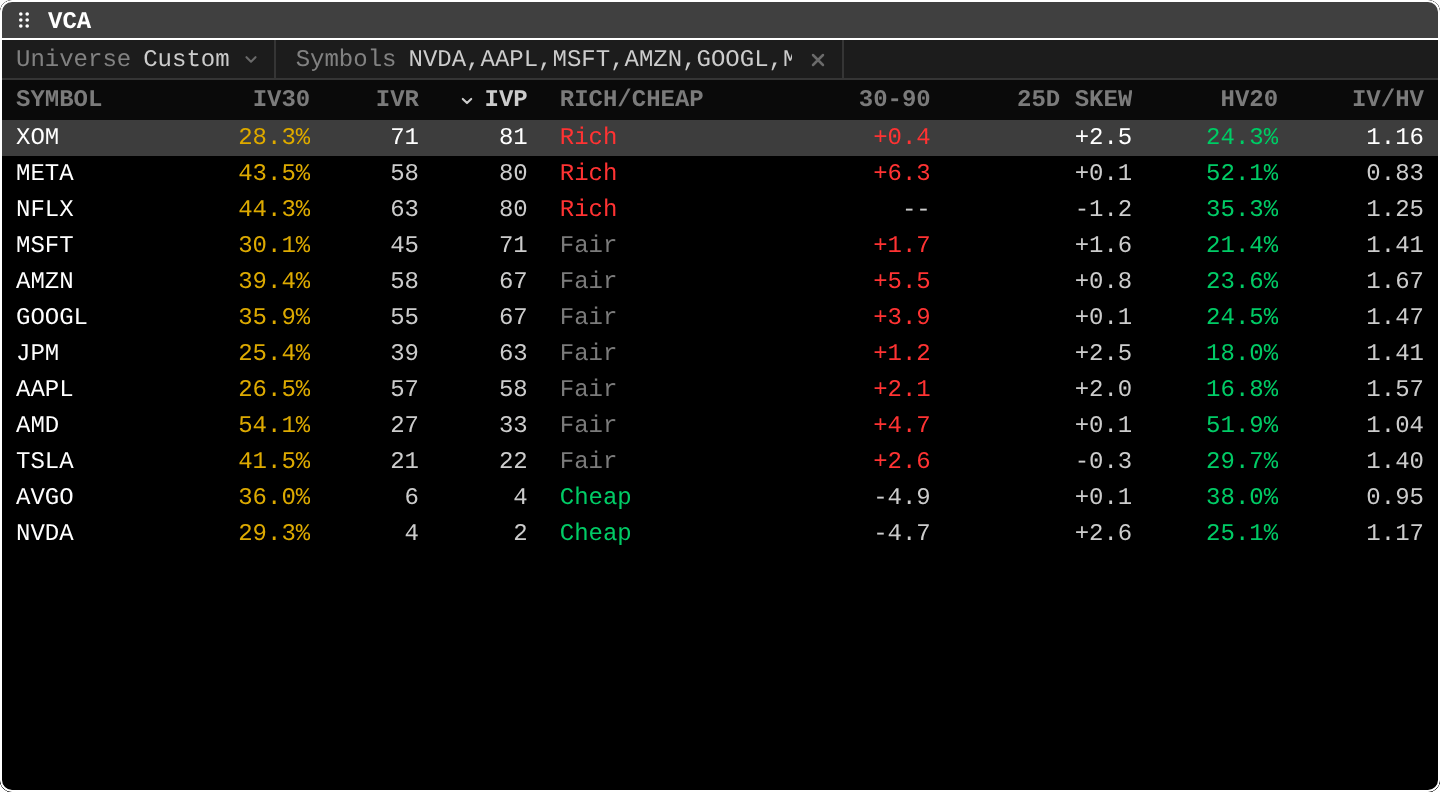
VCAVolatility rich/cheap
IV rank across a listIV rank, term slope, skew, and IV against realized vol for up to 60 US tickers, flagged rich or cheap against each name's own year. Without tickers it screens index and sector ETFs.
- Example
VCA NVDA, AAPL, TSLA - Learn it in the Academy: Is implied vol high or low? (HIVG, VCA)
- Example
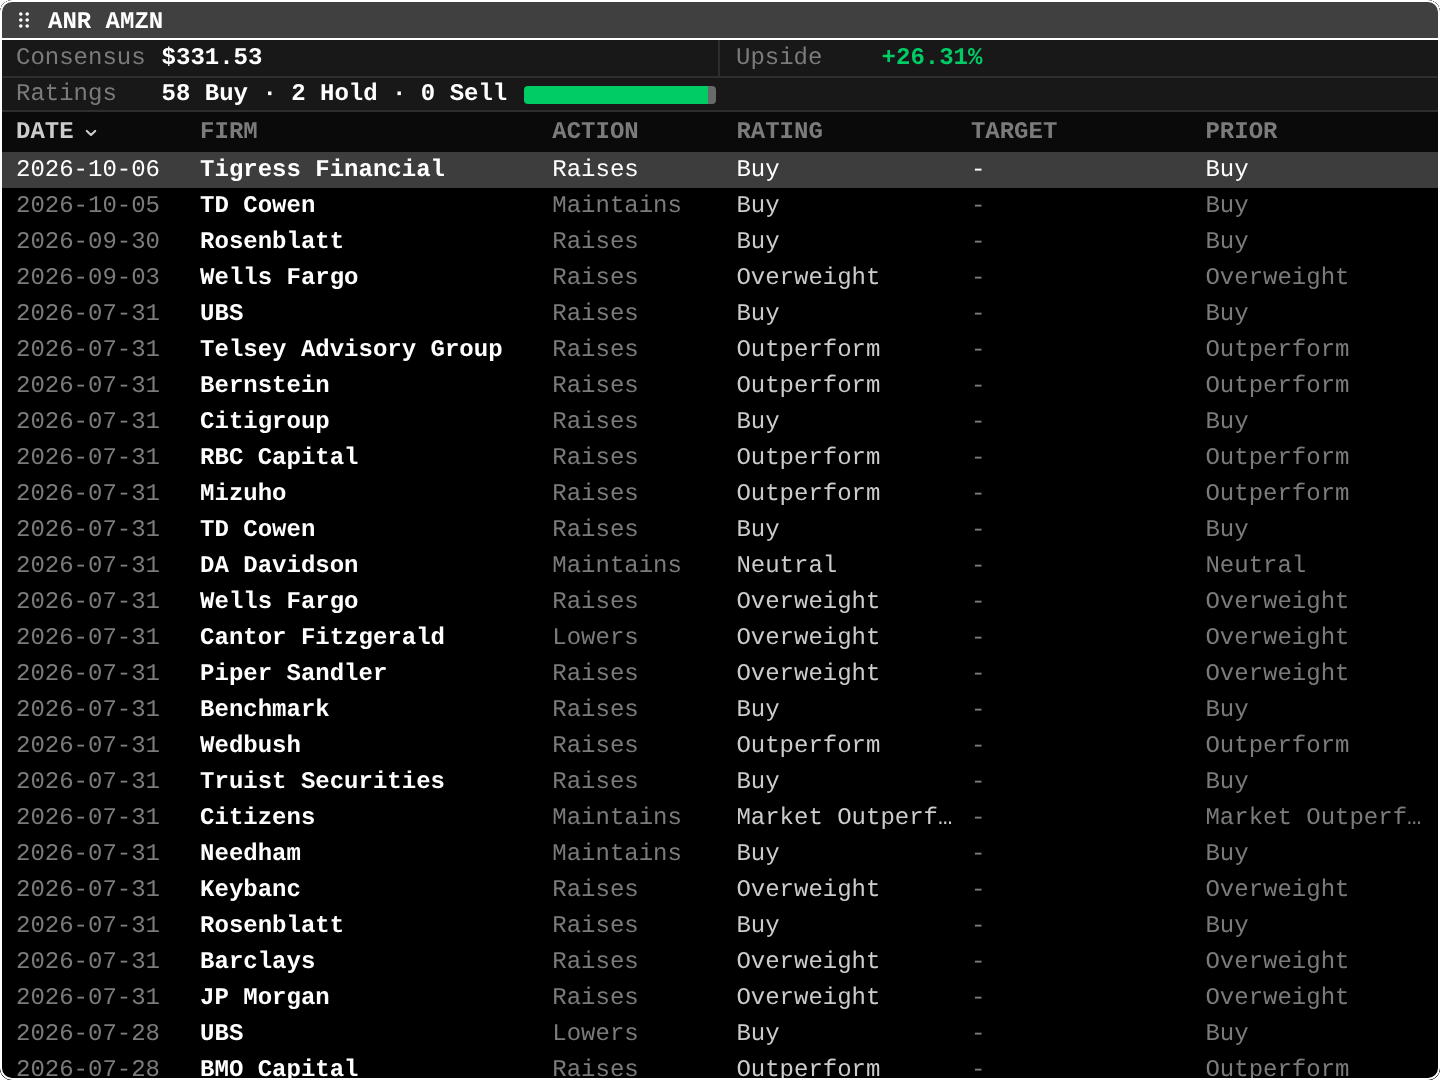
ANRAnalyst research
Targets and ratingsConsensus price target with the range, the rating distribution, and recent upgrades, downgrades, and initiations by firm.
- Example
ANR AMZN - Learn it in the Academy: Analyst ratings and price targets (ANR)
- Example
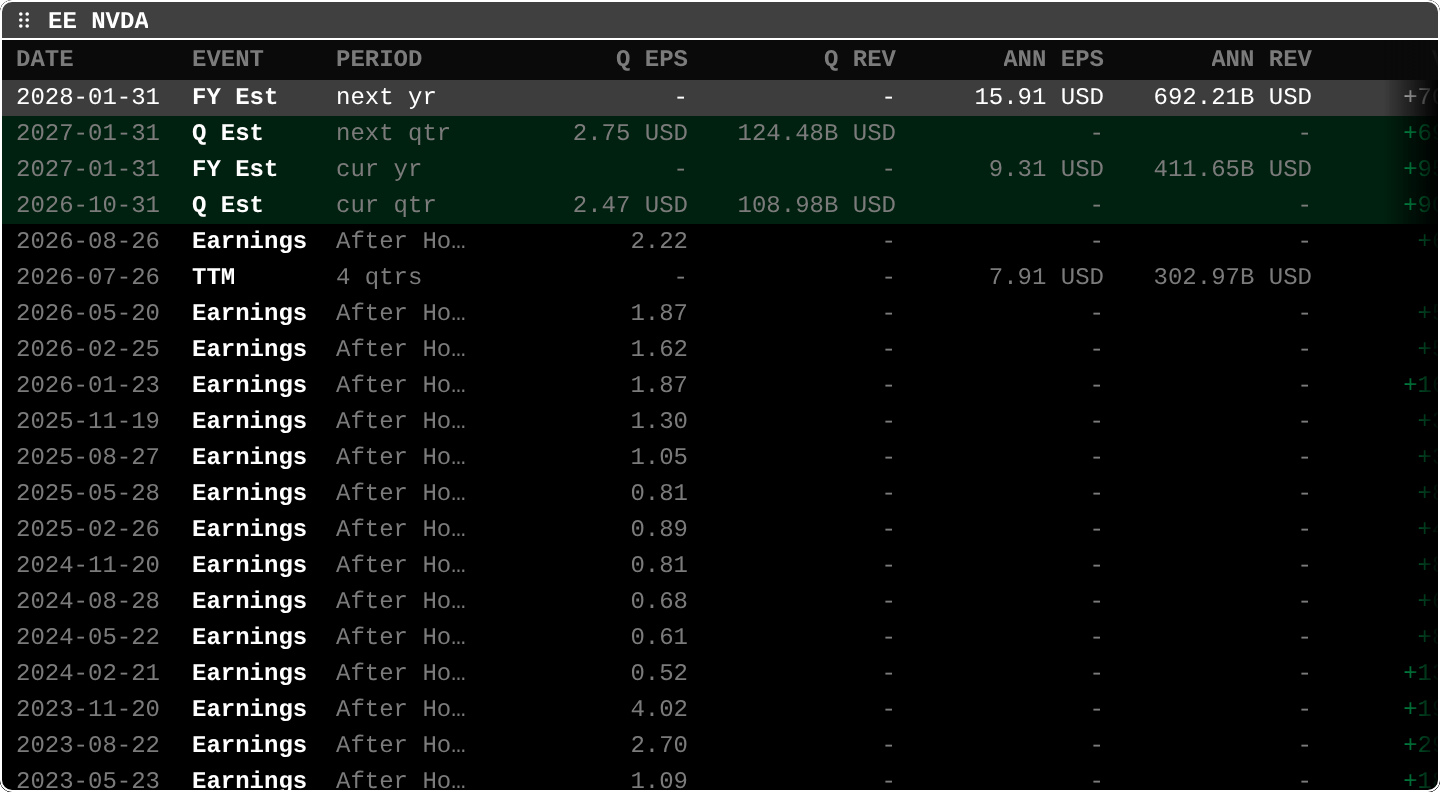
EEEarnings estimates
EPS and revenue estimatesQuarterly and annual EPS and revenue estimates next to reported results, with beats and misses.
EMEstimate revisions
Consensus EPS changesCloudConsensus EPS by quarter and year with its latest change, 30-day up and down revisions, and range; open a period to chart it. Surprises and Guidance tabs too. EEO opens it too.
KPISCompany KPIs
Cited operating metricsProCompany-reported operating metrics by fiscal period, with native currencies, definitions, charts, source quotes and retained restatements. Three latest series are free to preview; full history is Pro.
GUIDEGuidance tracker
Guidance revisions and outcomesProManagement guidance as dated ranges and points, with raises, cuts, withdrawals and later actuals when the period and accounting basis match. Cited evidence and revision history. Three current guides are free to preview; full coverage is Pro.
- Example
GUIDE NVDA - Learn it in the Academy: Guidance (GUID, GUIDE)
- Example
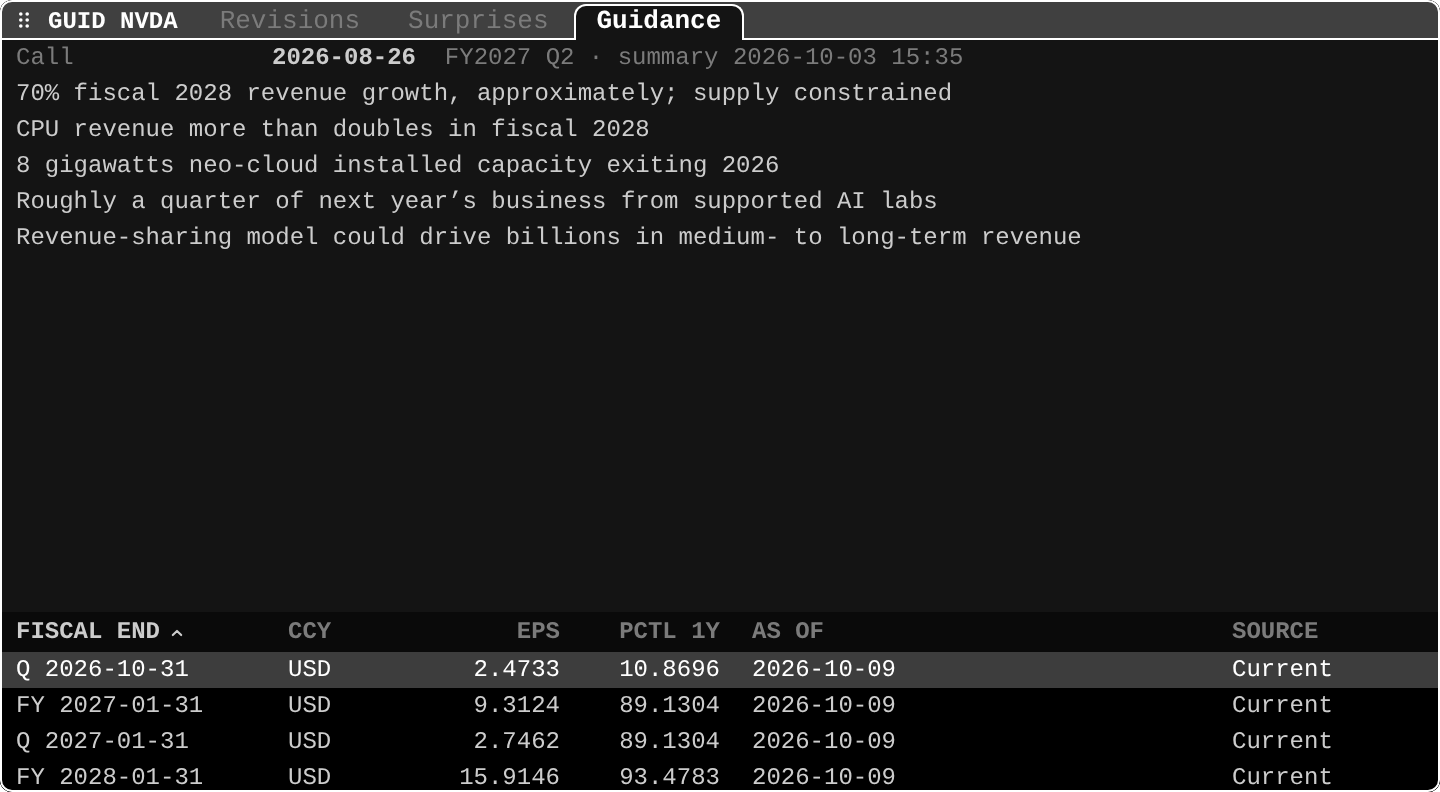
GUIDCompany guidance
Outlook from the latest callCloudThe outlook the company gave on its latest earnings call, above consensus for the coming periods. US listings. The Guidance tab of EM.
- Example
GUID NVDA - Learn it in the Academy: Guidance (GUID, GUIDE)
- Example
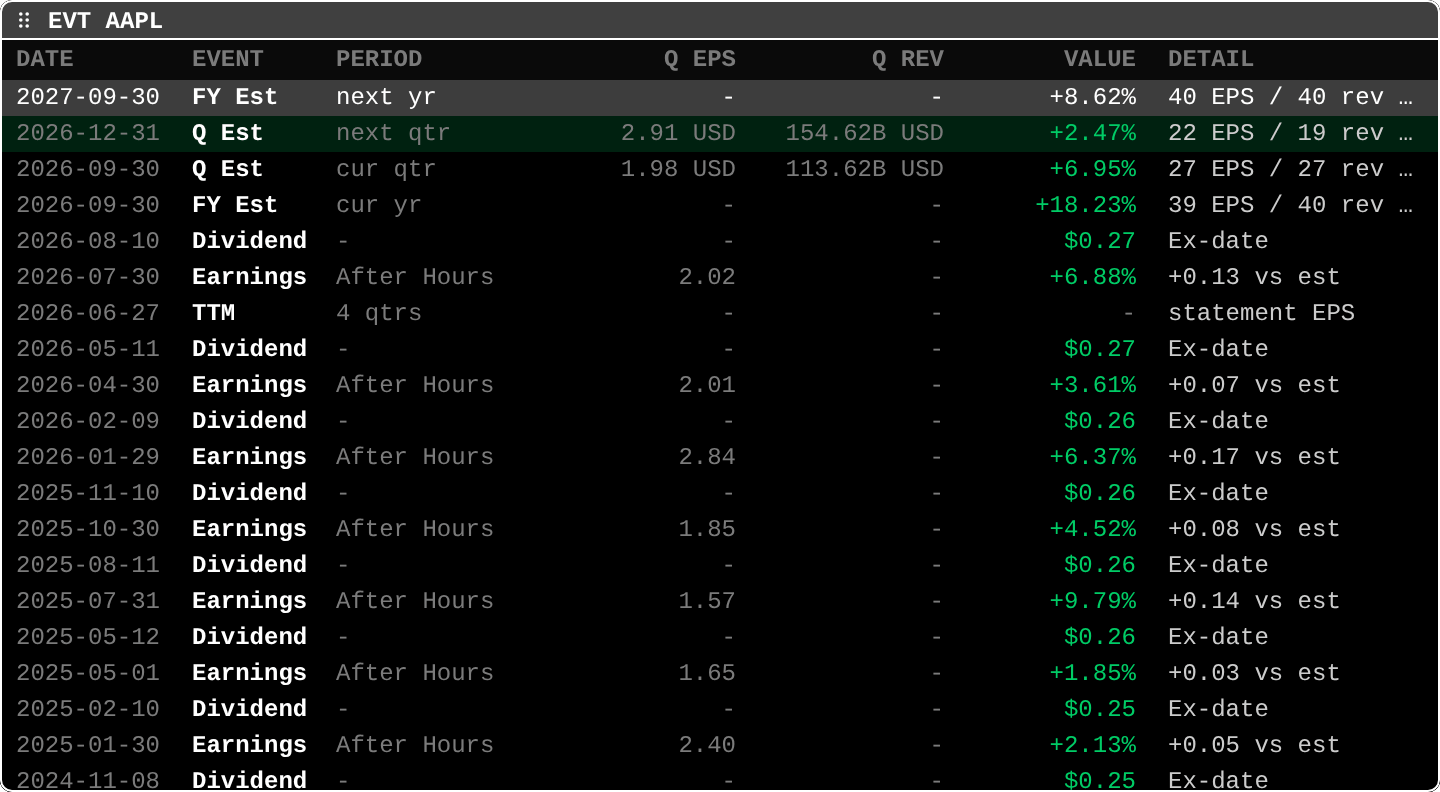
EVTCorporate actions
Dividends, splits, earningsDividend and split history plus past and upcoming earnings dates and estimates in one timeline.
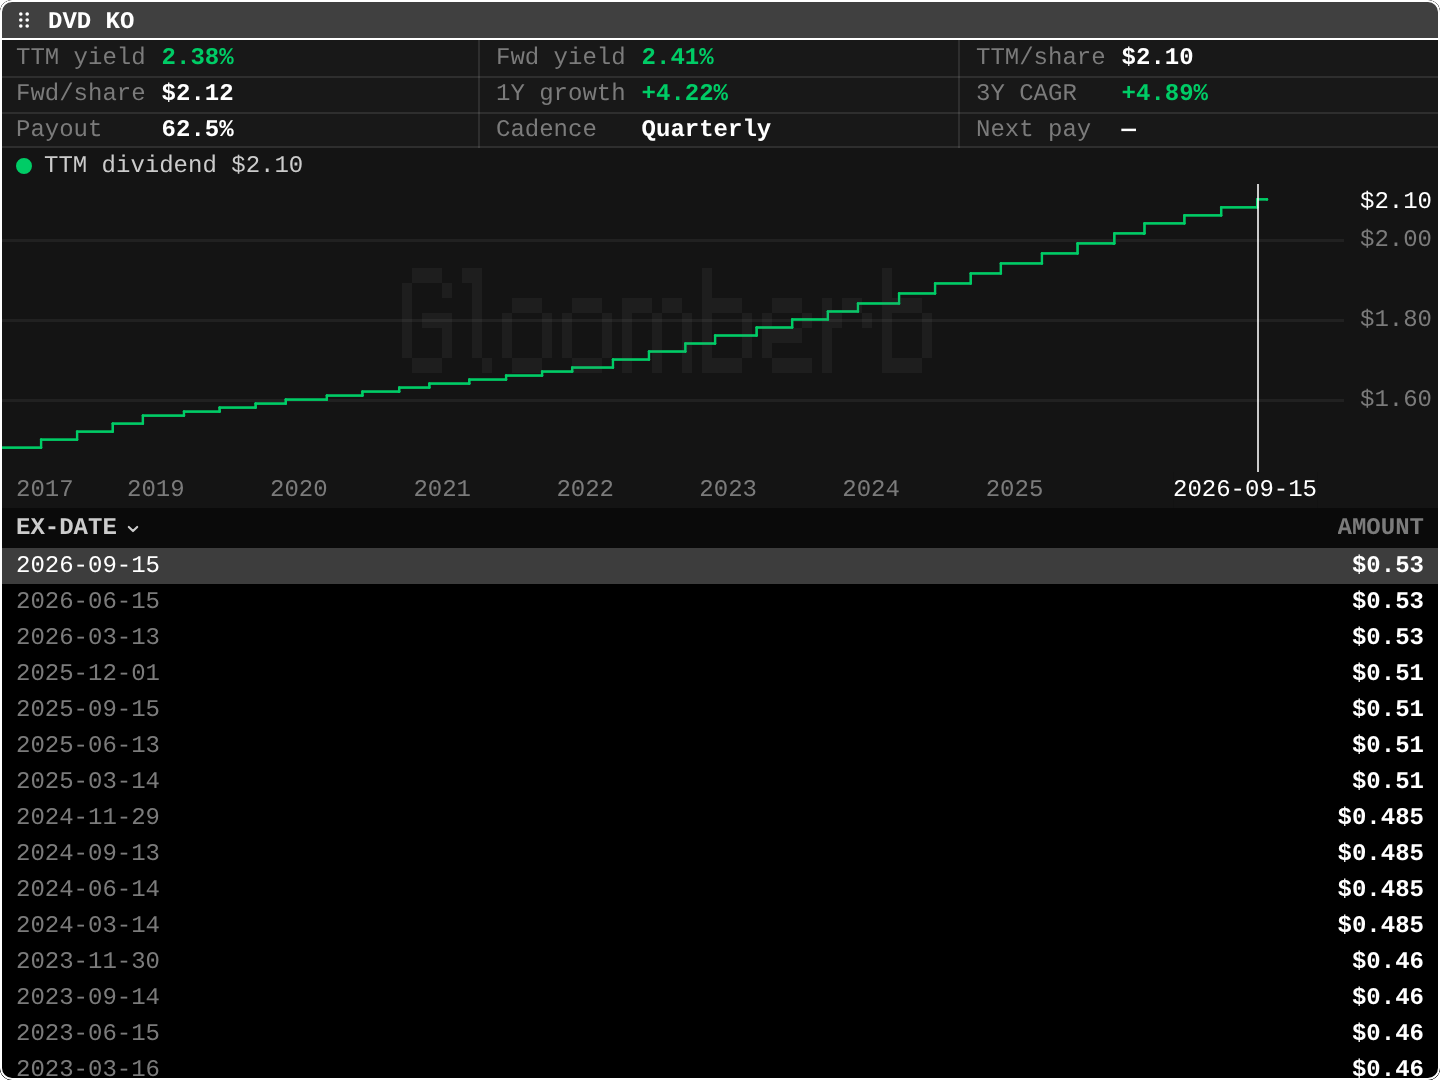
DVDDividend yield
Payout history and yieldCash distributions, trailing yield, indicated rate when available, and payout growth. Future payments are not forecast.
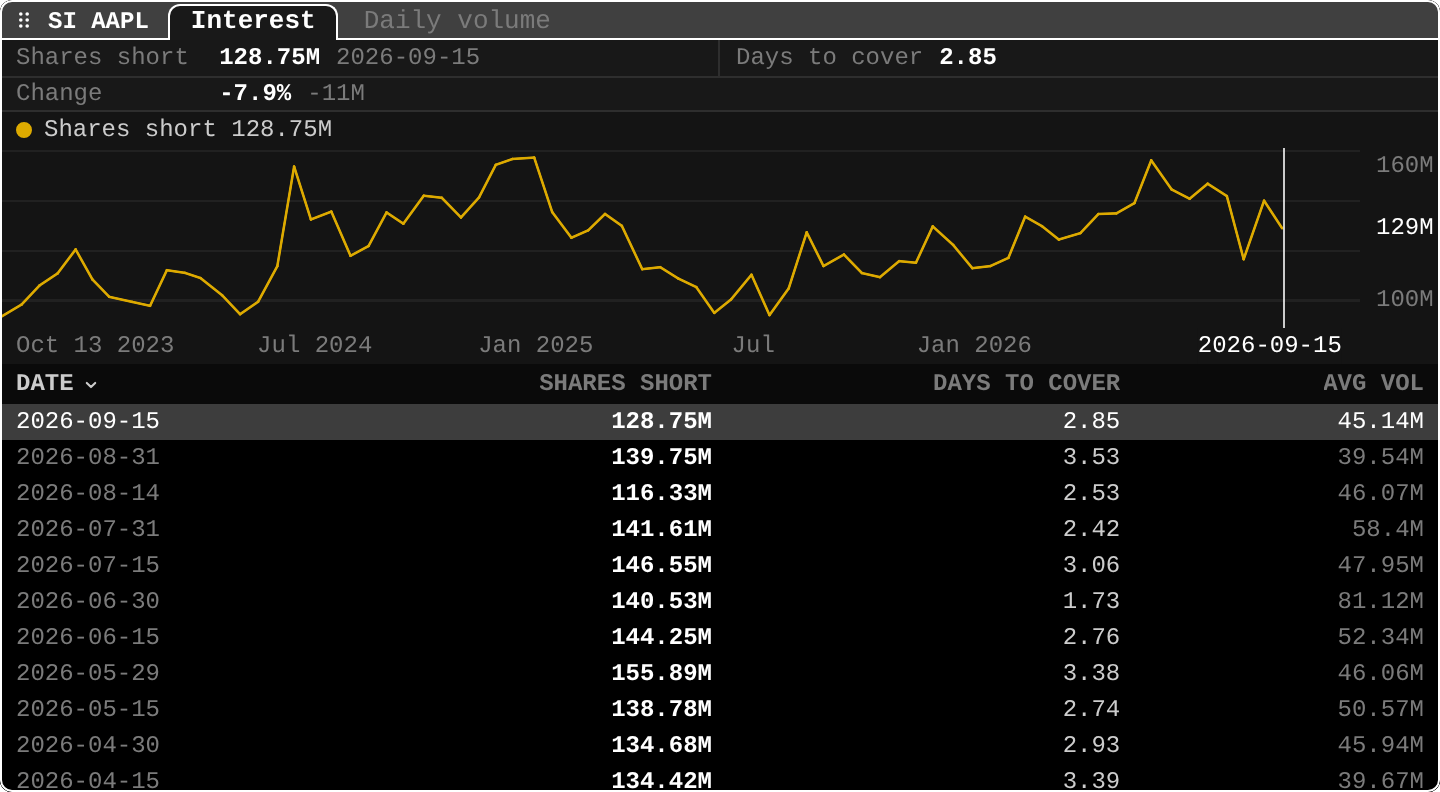
SIShort interest
FINRA short interestBi-monthly FINRA settlement data with shares short, days to cover, and average daily volume over time.
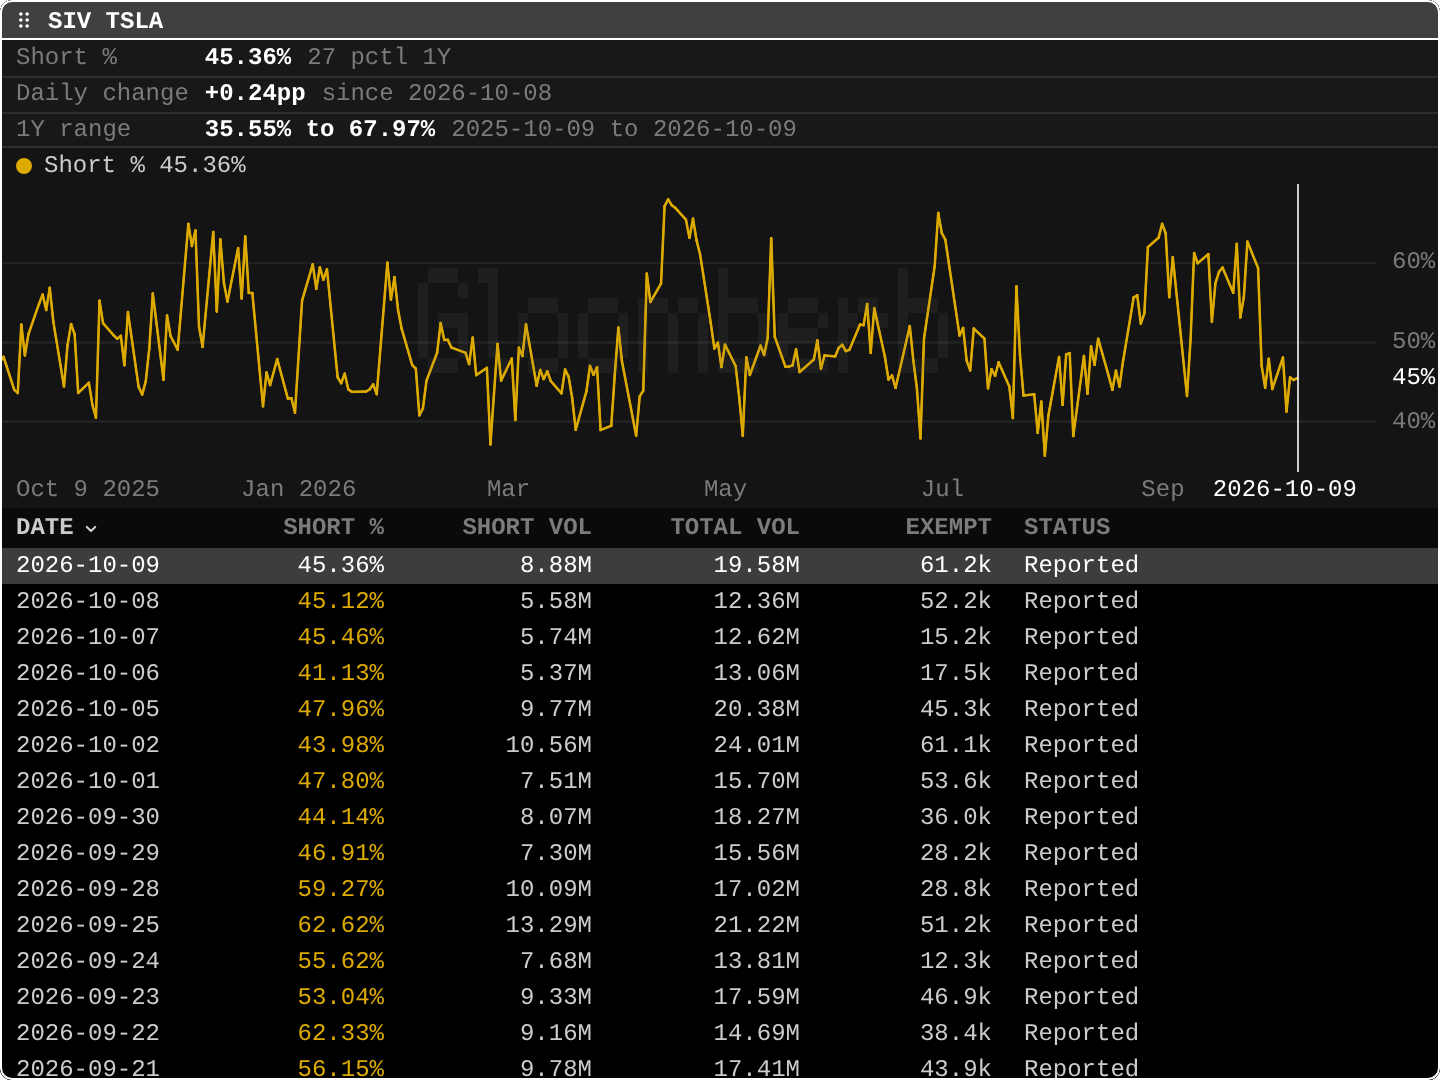
SIVDaily short volume
FINRA daily short ratioFINRA daily off-exchange short volume as a share of volume, charted against its one-year range. Not short interest; SI has that.
FTDFails to deliver
Outstanding settlement failsThe Short Interest pane on Fails to deliver: SEC outstanding fail shares by settlement date and CUSIP, with reported prices. Each date is a separate snapshot; never add fails across dates. Published twice monthly with a delay. Missing records do not establish zero fails.
- Example
FTD AAPL
- Example
ATSWeekly ATS / OTC volume
Weekly off-exchange shares and tradesThe Short Interest pane on Weekly ATS/OTC: FINRA ATS and non-ATS shares and trades, including dark-pool activity. ATS % divides ATS shares by published off-exchange shares, not total market volume or short volume. Missing categories stay blank. Published weekly with a two- or four-week delay depending on the security tier.
- Example
ATS AAPL
- Example
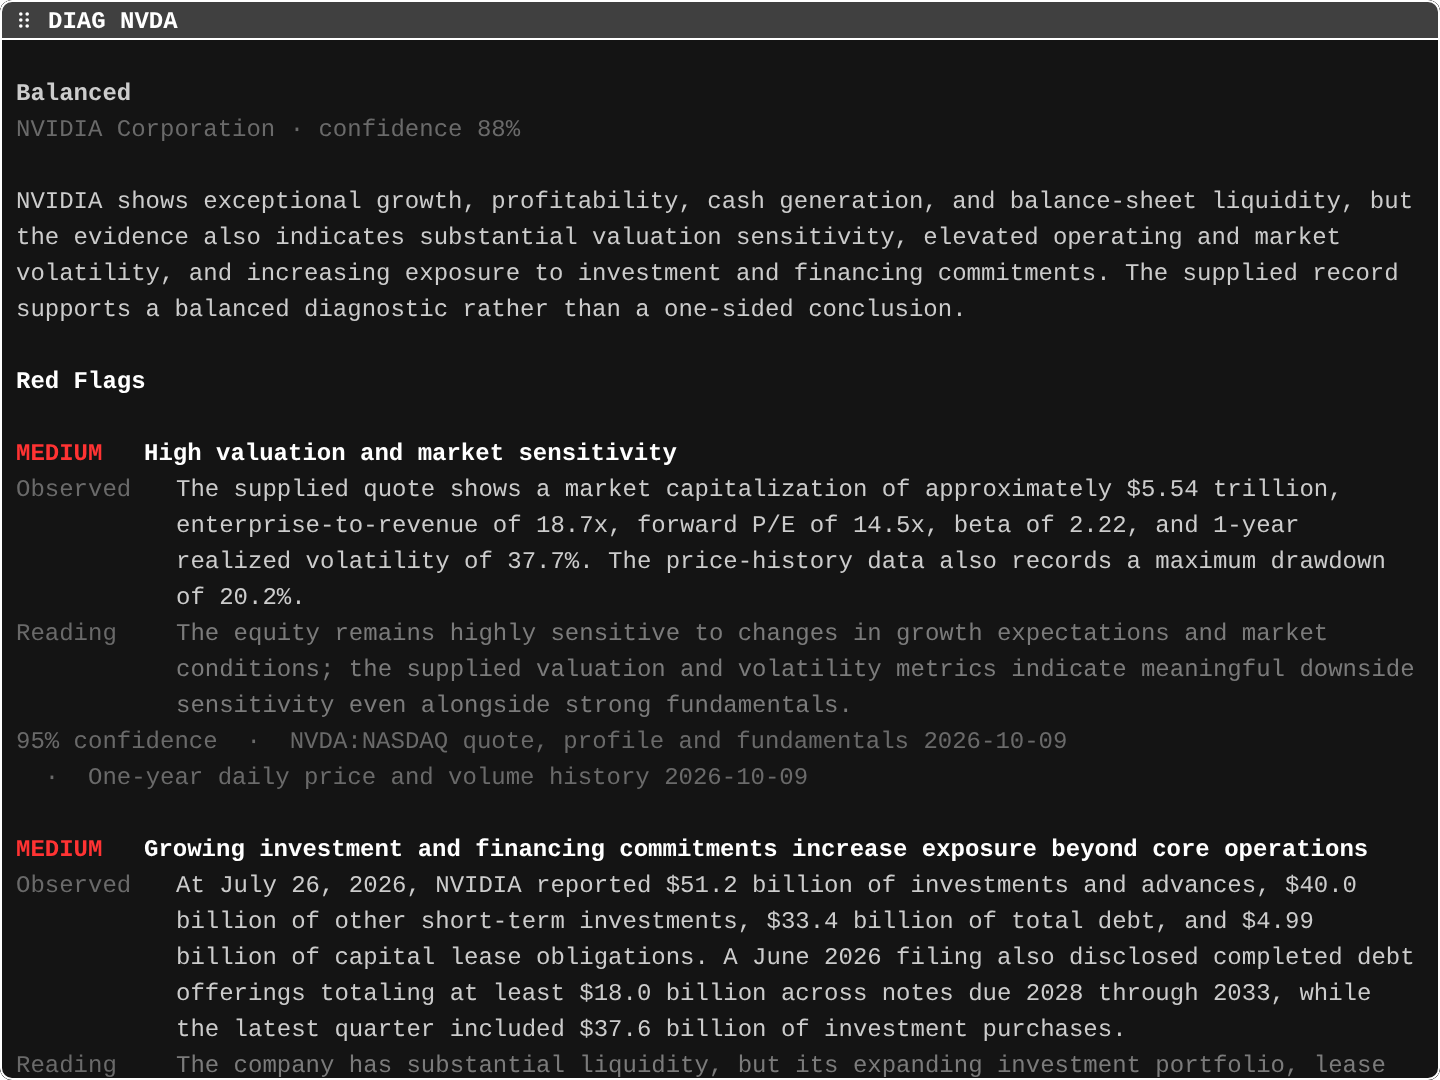
DIAGEquity diagnostic
Red and green flagsProA read of the company's filings and numbers into red flags, anomalies, green flags, and items to watch, each with the evidence it came from.
- Example
DIAG NVDA - Learn it in the Academy: Red and green flags (DIAG)
- Example
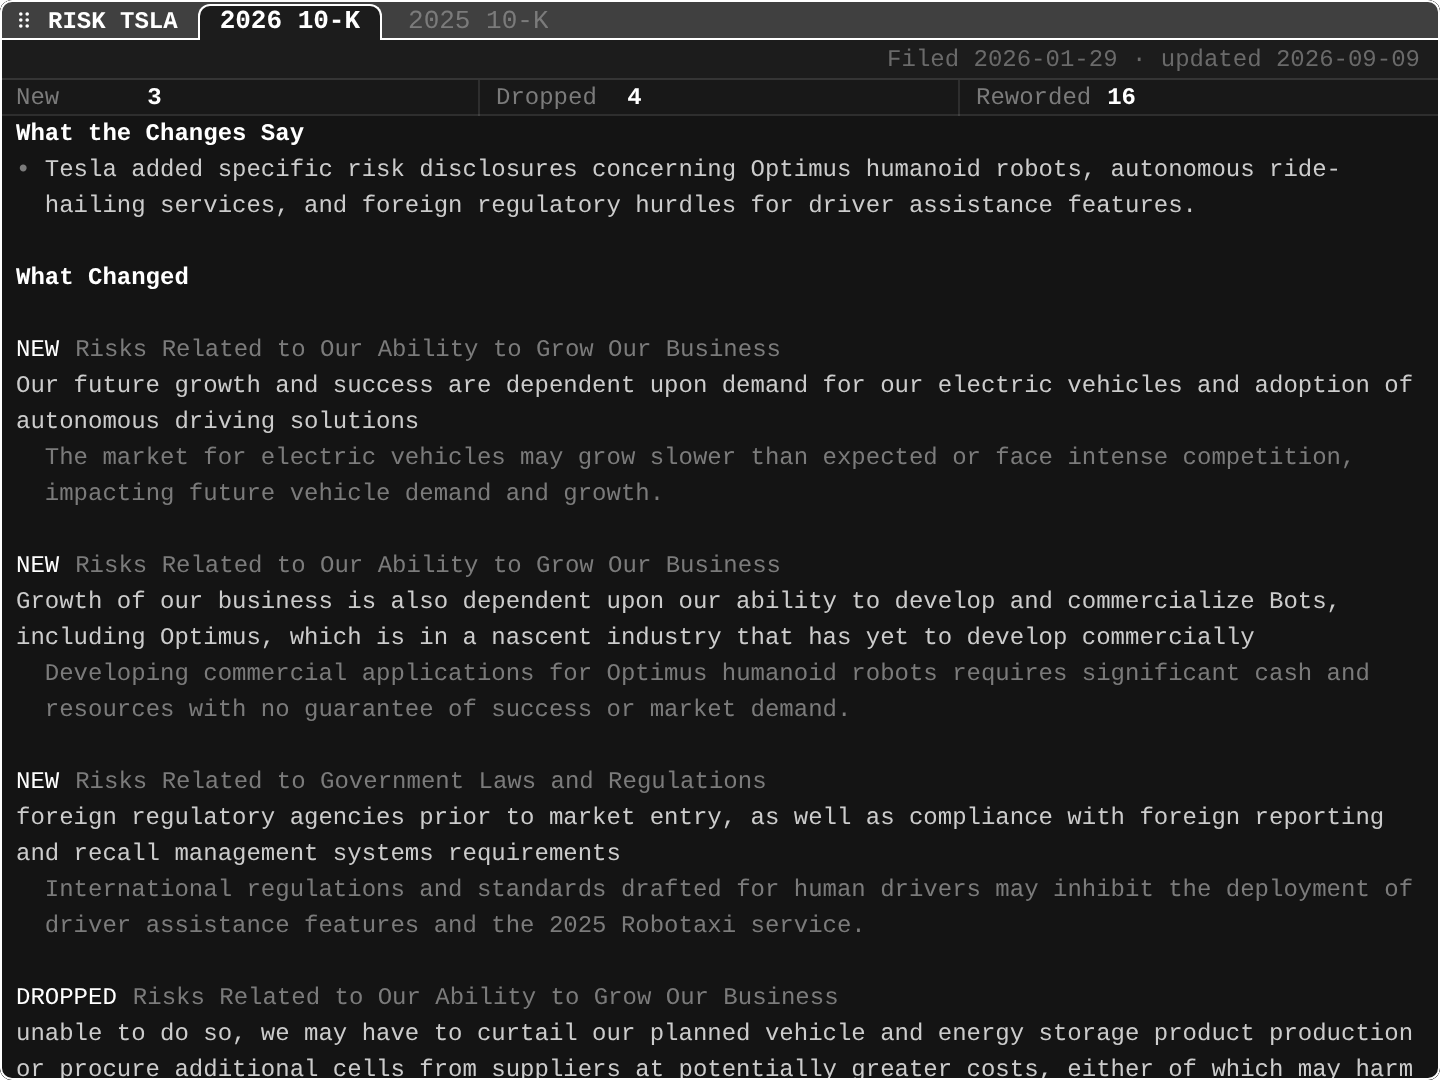
RISKRisk factors
10-K risks and what changedProThe 10-K risk factor section grouped by theme, with the items that were added, dropped, or rewritten since the prior year called out.
- Example
RISK TSLA - Learn it in the Academy: Risk factors (RISK)
- Example
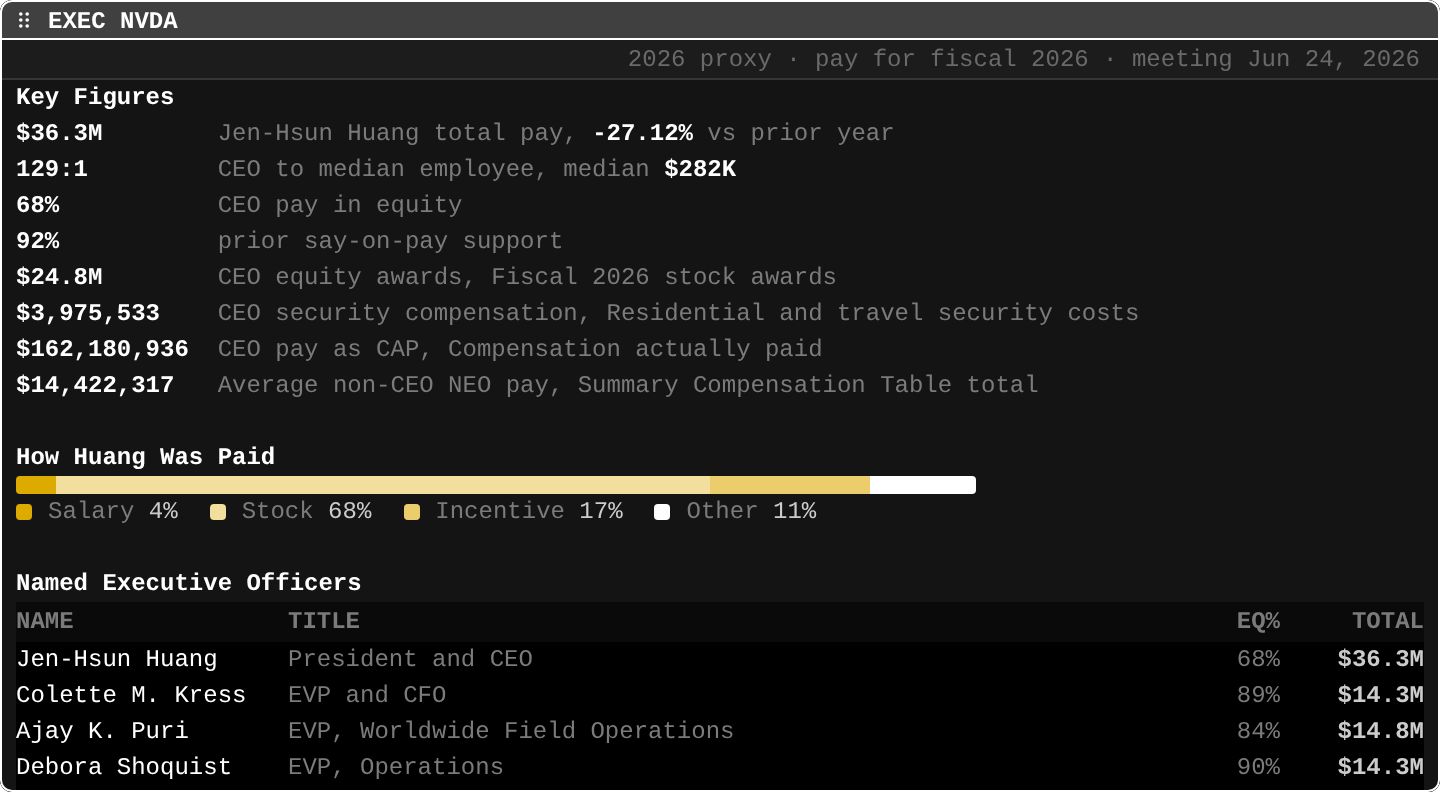
EXECExecutives
Officers and pay from the proxyProNamed executive officers and their compensation. Free shows each executive's total pay; Pro adds the breakdown and earlier years.
- Example
EXEC NVDA - Learn it in the Academy: Executive pay (EXEC)
- Example
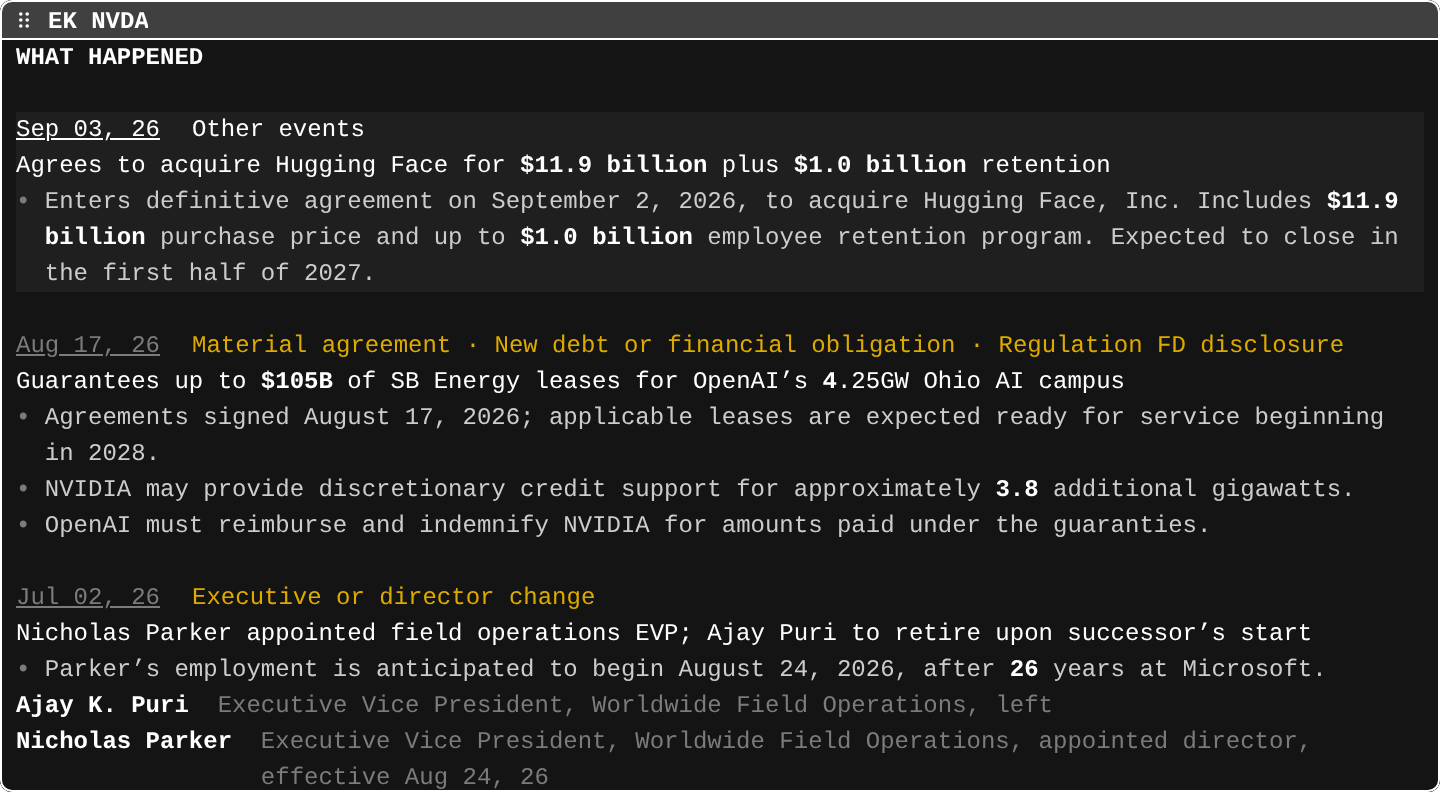
EK8-K filings
8-Ks classified and readProThe company's 8-Ks classified by item (agreements, executive changes, auditor changes, restructurings) with a summary of what each one said.
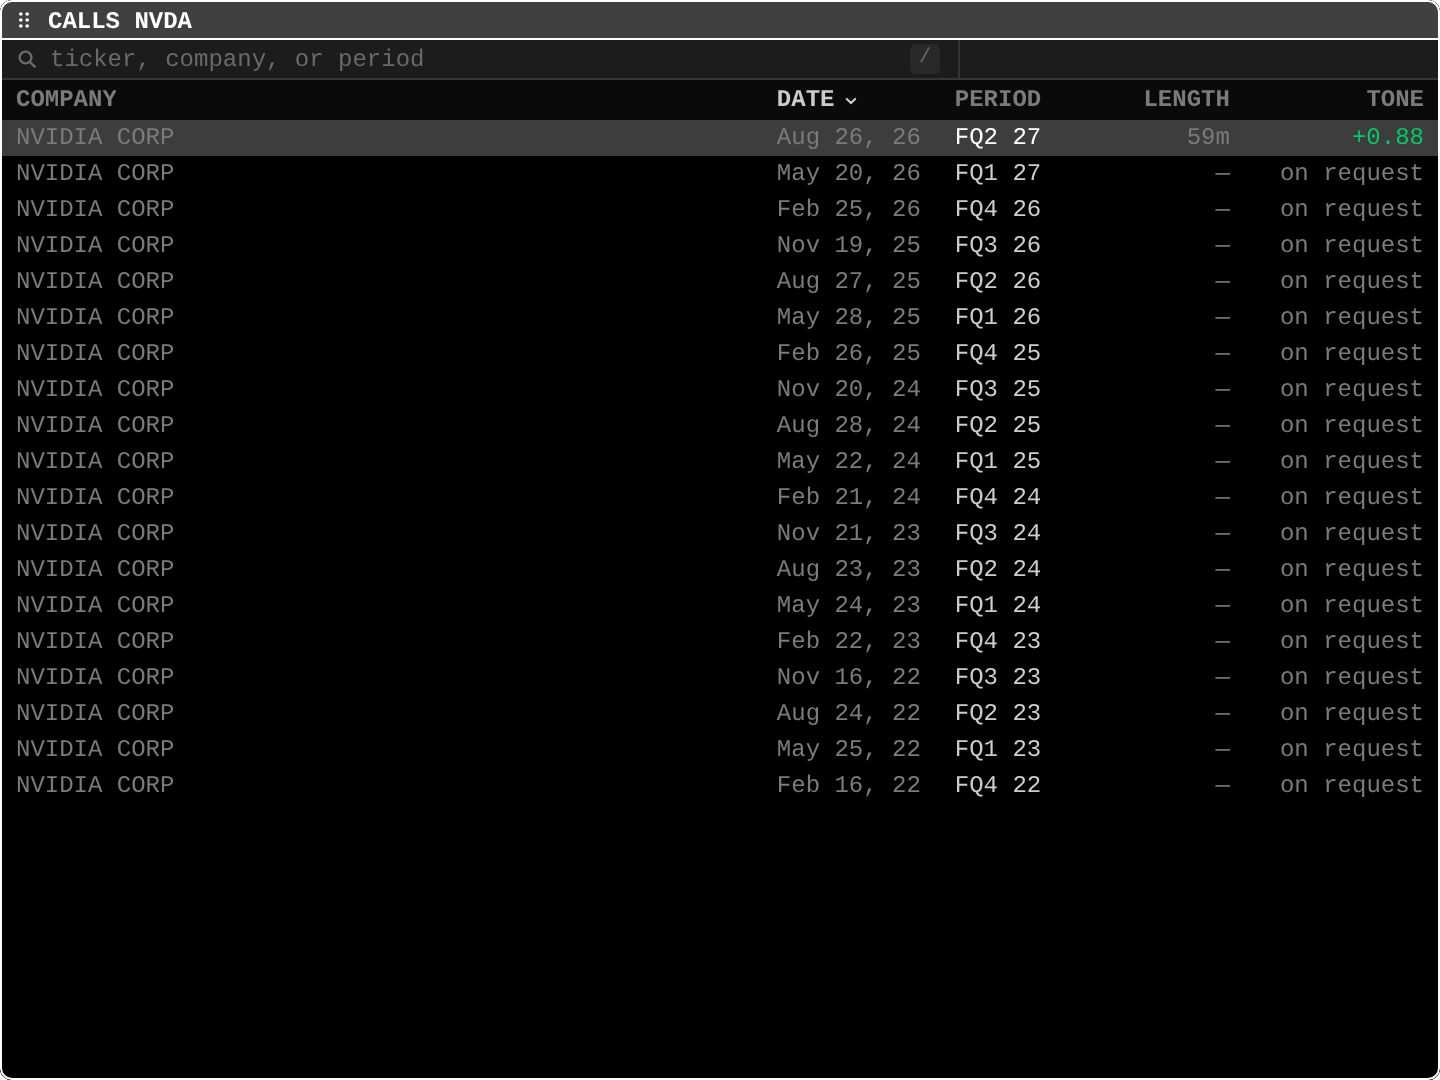
CALLSEarnings calls
Transcripts and guidanceProEarnings call transcripts with speaker attribution, the analyst Q&A, and guidance and notable quotes. Without a ticker it lists new calls as they land.
- Example
CALLS NVDA - Learn it in the Academy: Earnings calls (CALLS)
- Example
HIREHiring momentum
Company hiring trends and evidenceProWeekly open roles, role and location mix, remote share, hiring changes and peers for one company. Pro shows the full history; Free shows the latest values and three rows per section.
- Example
HIRE NET - Learn it in the Academy: Hiring signals (JOBS, HIRE)
- Example
APPSApp attention
App ranks, ratings and company momentumProPublic app chart ranks by storefront, matched rank velocity, rating drift, country spreads and listed-parent comparisons. Open an app for its rank history.
- Example
APPS META - Learn it in the Academy: App store rankings (APPS)
- Example
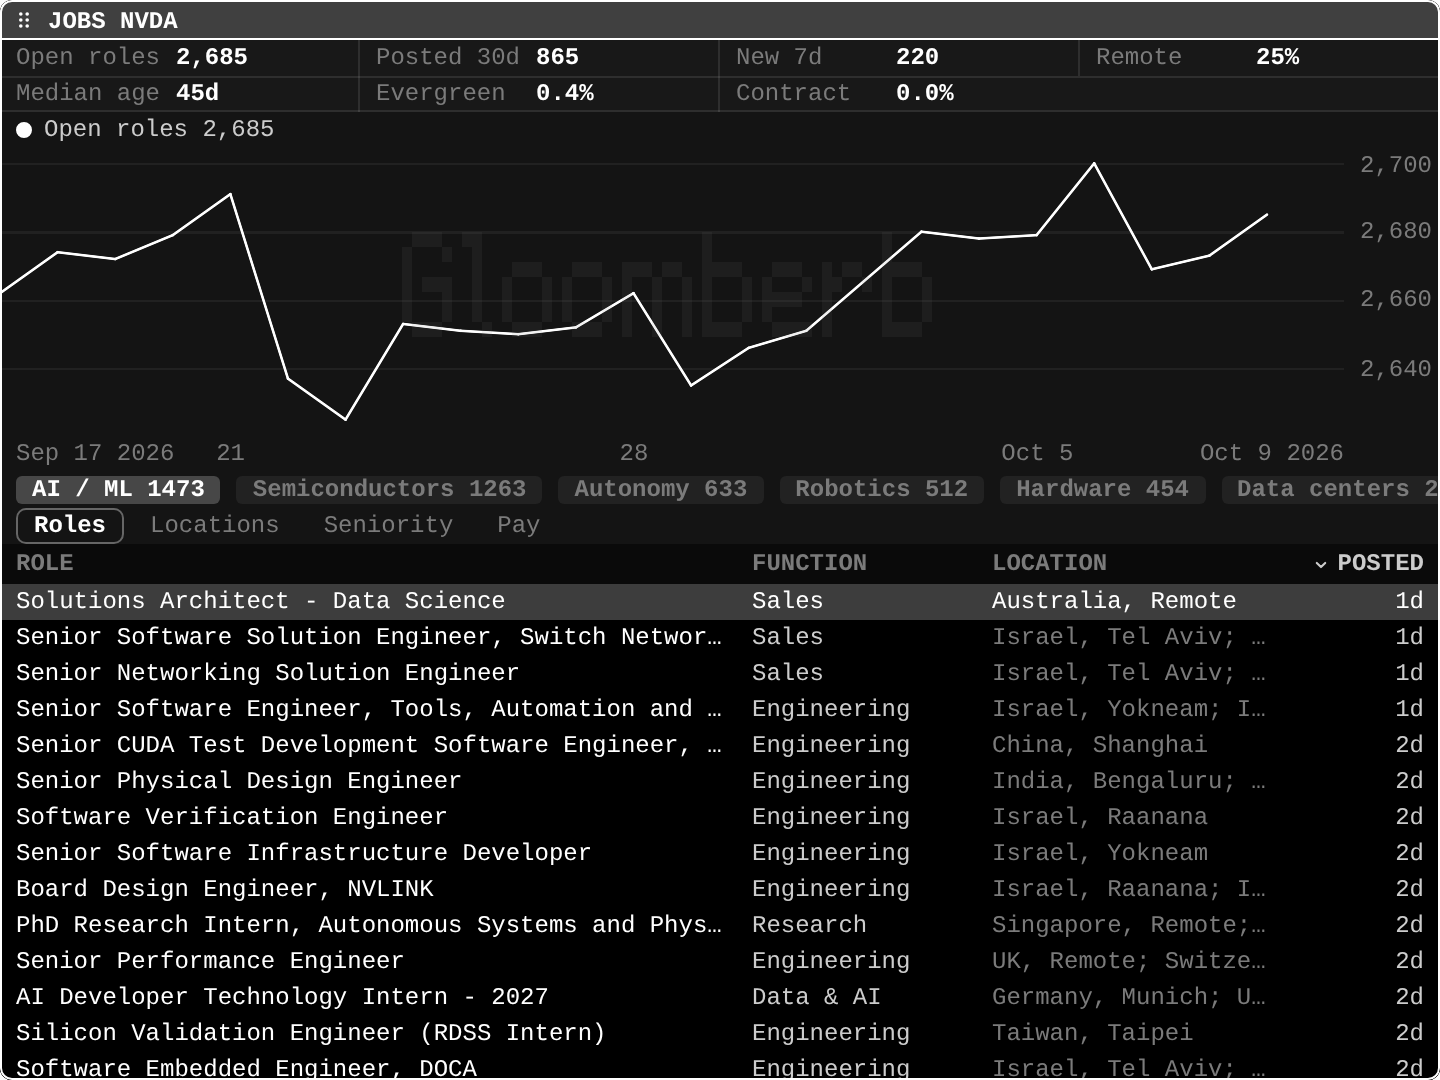
JOBSHiring
Open roles, by function, over timeProOpen roles read daily from a company's own careers site: trend, function, country, seniority, new roles, pay ranges and themes such as AI. Without a ticker it ranks every covered company.
- Example
JOBS NVDA - Learn it in the Academy: Hiring signals (JOBS, HIRE)
- Example
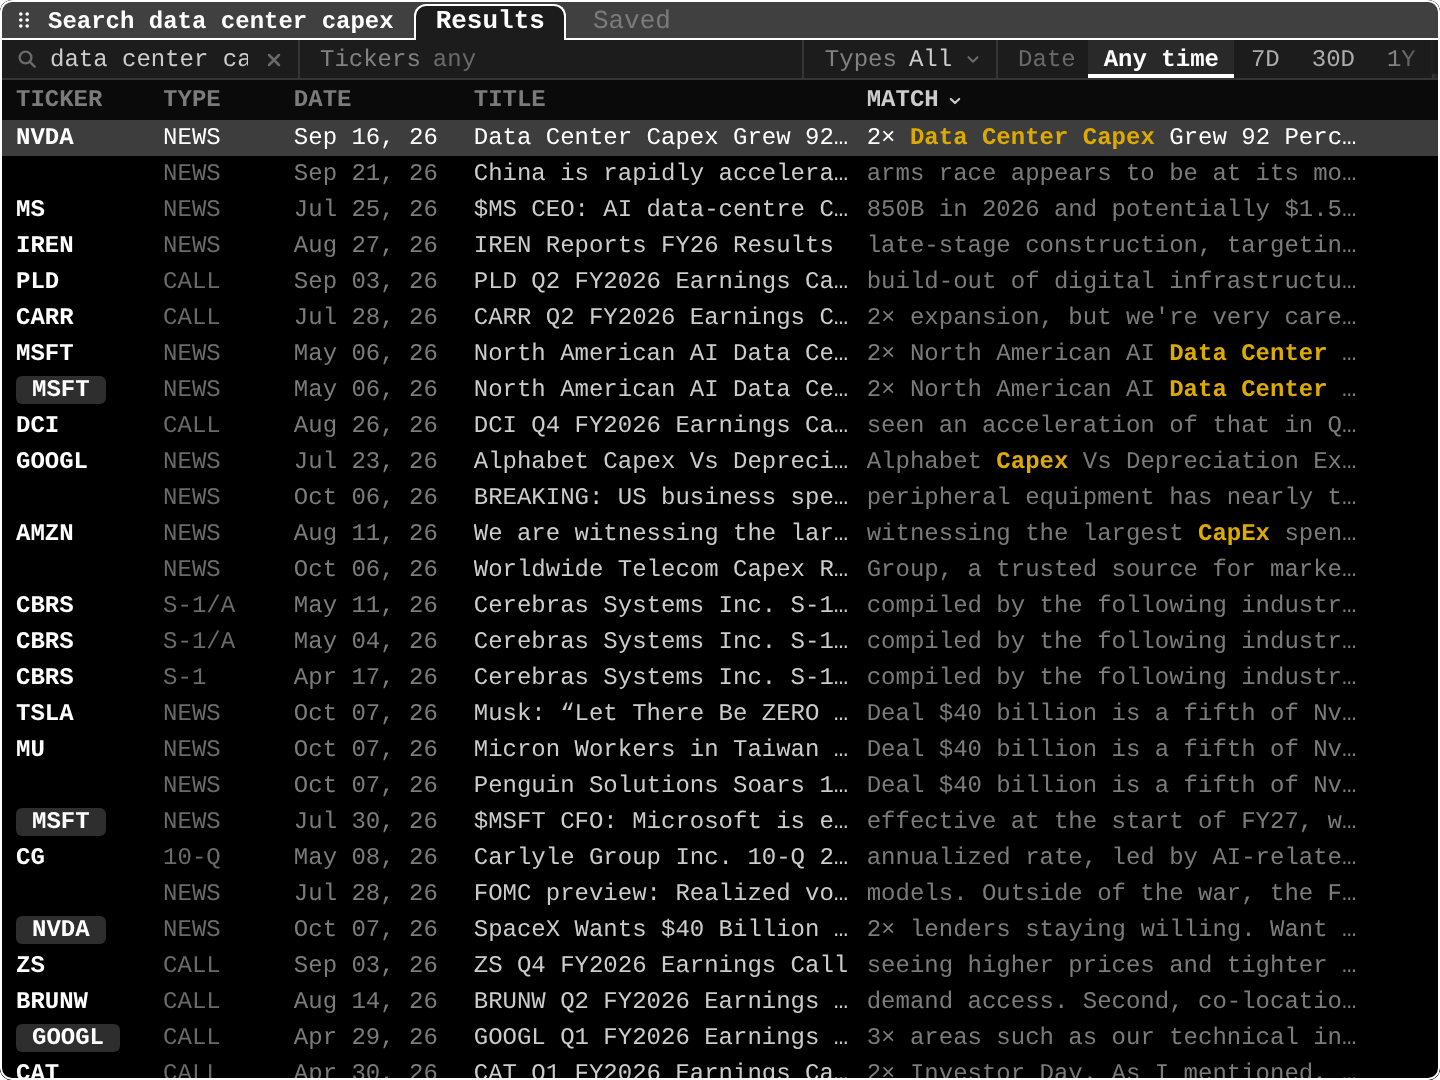
SRCHResearch search
Search calls, wires, filingsProFull-text search across earnings call transcripts, news wires, and SEC filings, with the matching passage inline. Save a search to get alerted on new hits.
- Example
SRCH data center capex - Learn it in the Academy: Searching calls, news and filings (SRCH)
- Example
AIAI screener
Prompt-driven screenerPluginDescribe a screen in plain language and get a table of matching tickers, saved as a reusable tab. Uses the AI provider you configure.
AGENTAI agent
Persistent AI threadPluginA long-running AI thread with your choice of model that can read your panes and run research commands for you.
ASKGAsk Gloom
Ask about your panesCloudAsk a question about what is on screen and watch the tools Gloom runs to answer it. Requires a verified Cloud account.
- Example
ASKG question - Learn it in the Academy: The AI helpers (ASKG, AI, AGENT)
- Example
EXPOExposure engine
Scenario shocks and evidence pathsProApply country, supplier, customer, tariff, commodity, rate and FX shocks to holdings and see exposure ranges and the paths behind them. Free previews one holding and one hop; Pro covers 100 holdings and four hops.
AWARDSGovernment awards
Public contracts mapped to companiesProGovernment awards, subcontractors and modifications with verified company matches, native-currency amounts, agency concentration, sector rankings, cumulative obligations and primary-source evidence. Pro includes filters and history; everyone can view a three-row preview.
- Example
AWARDS LMT - Learn it in the Academy: Government contracts and awards (AWARDS)
- Example
SEGRevenue breakdown
Revenue by product, segment, regionProQuarterly revenue by product, segment or region from the company's 10-Q and 10-K filings. Free shows the first two lines; Pro shows every line.
RDCFReverse DCF
What growth the price assumesThe yearly free cash flow growth over ten years that makes a DCF equal today's enterprise value, next to the growth the company actually delivered.
- Example
RDCF AAPL - Learn it in the Academy: What growth is priced in? (RDCF)
- Example
PEBP/E band
Price against multiples of EPSWeekly price against round multiples of trailing EPS, stepping when each EPS figure became known, with today's P/E ranked in the stock's own history.
- Example
PEB AAPL - Learn it in the Academy: Valuation over time (GE, GF, PEB)
- Example
RETURNReturns
Interval and cumulative returnsInterval and cumulative price returns in a scrollable table, for a range and granularity you pick.
- Example
RETURN AAPL - Learn it in the Academy: The returns table (RETURN)
- Example
MDAYMacro-day reaction
How a name moves on CPI, jobs, FOMCA name's average move on CPI, jobs report and FOMC days against a normal day, with the share of up days and the move on every release day.
- Example
MDAY SPY - Learn it in the Academy: How a stock reacts on macro days (MDAY)
- Example
SIWShort squeeze watch
Crowded shorts that are moving upShort interest as a share of float, days to cover, the change since the prior settlement and the month's price move across your portfolios and watchlists, or the tickers you give. Updates twice a month.
- Example
SIW GME, AMC, CVNA - Learn it in the Academy: Short interest and squeezes (SI, SIV, SIW)
- Example
RIPLEarnings ripple
Holdings tied to a company reporting soonCustomers your holdings name in their filings, and suppliers whose filings name your holdings, with the disclosed revenue share, by report date.
- Example
RIPL CRUS QRVO - Learn it in the Academy: Earnings ripple (RIPL)
- Example
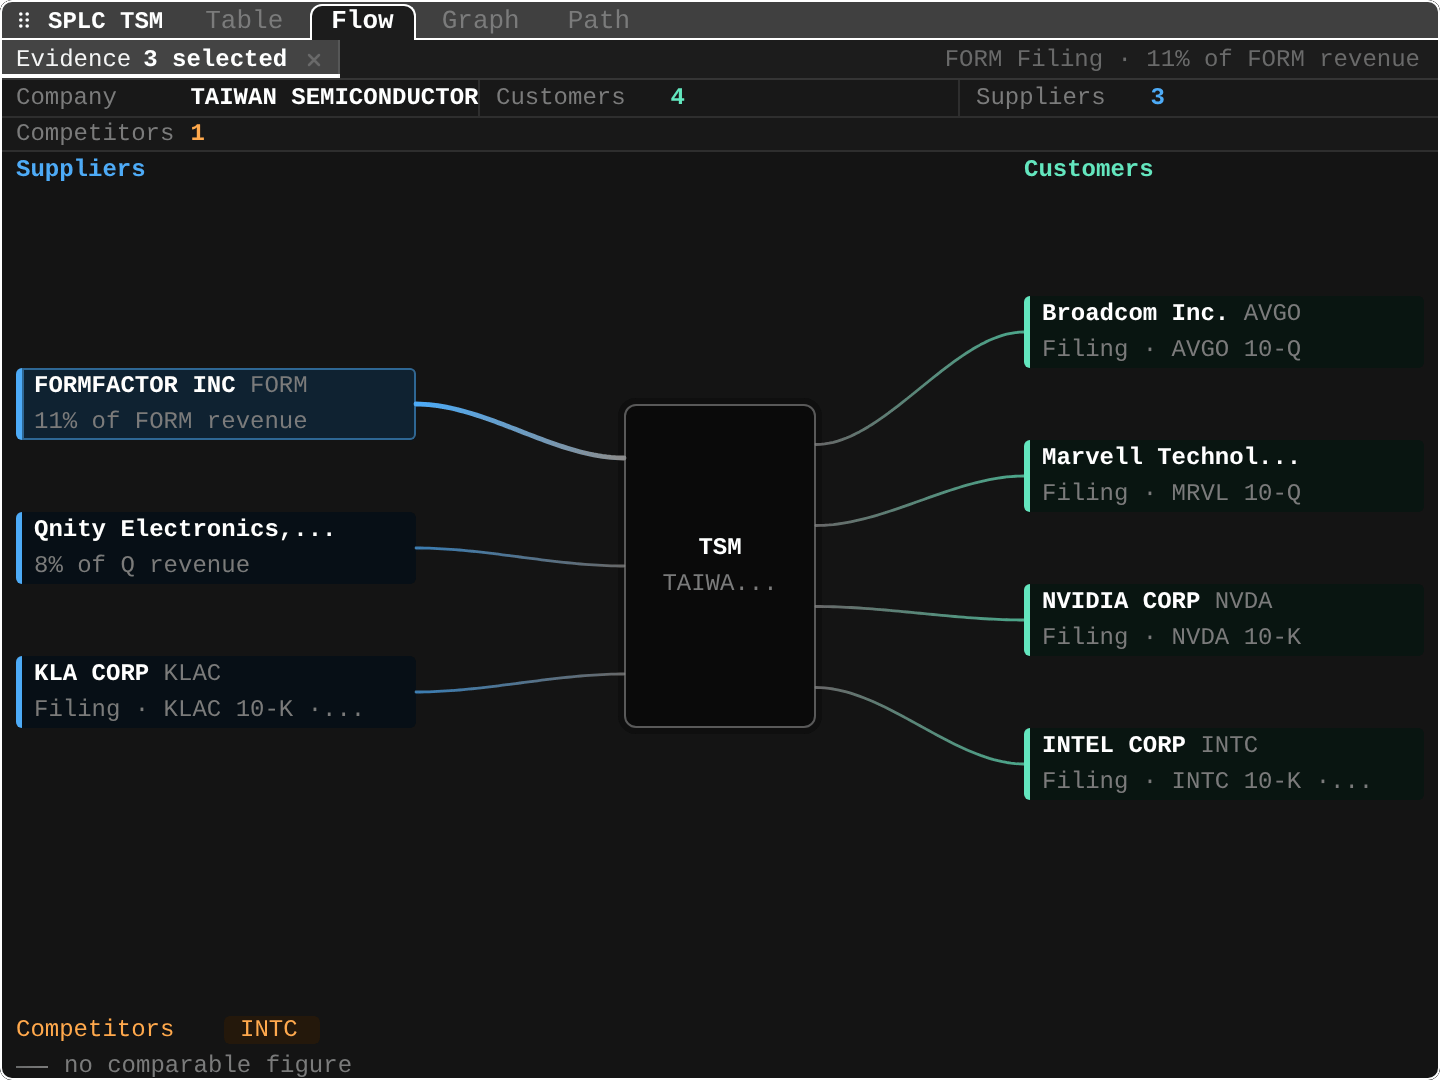
SPLCSupply chain
Suppliers, customers and partnersProWho a company buys from and sells to, with the filing, call or announcement behind each link: Table, Flow, Graph and Path views, up to four hops. Free previews three relationships per role; Pro shows everything.
CATLCatalysts
Clinical, regulatory and legal calendarProA calendar of regulatory, clinical, legal and trade-policy events linked to companies, with source documents and every revision. Free previews three events; Pro shows them all, with alerts.
- Example
CATL PFE - Learn it in the Academy: Catalysts (CATL)
- Example
LITILitigation
Cases, enforcement and antitrustProOne company's litigation, enforcement and antitrust cases, with primary documents and dated status changes. Free previews three events; Pro shows them all.
TRIALClinical trials
Studies by condition, drug or sponsorClinical studies by condition, drug or sponsor, with status, phase and enrollment. Open a study for its full record.
- Example
TRIAL semaglutide - Learn it in the Academy: Drug safety reports and clinical trials (FDA, TRIAL)
- Example
FDAFDA reports
Adverse events and recallsFDA drug and device adverse event reports and drug recalls, by drug, device or firm name. A report is what someone observed, not proof the product caused it.
- Example
FDA metformin - Learn it in the Academy: Drug safety reports and clinical trials (FDA, TRIAL)
- Example
Follow the news
10Ranked, chronological, breaking, sector, and ticker feeds, plus X and a few reader plugins.
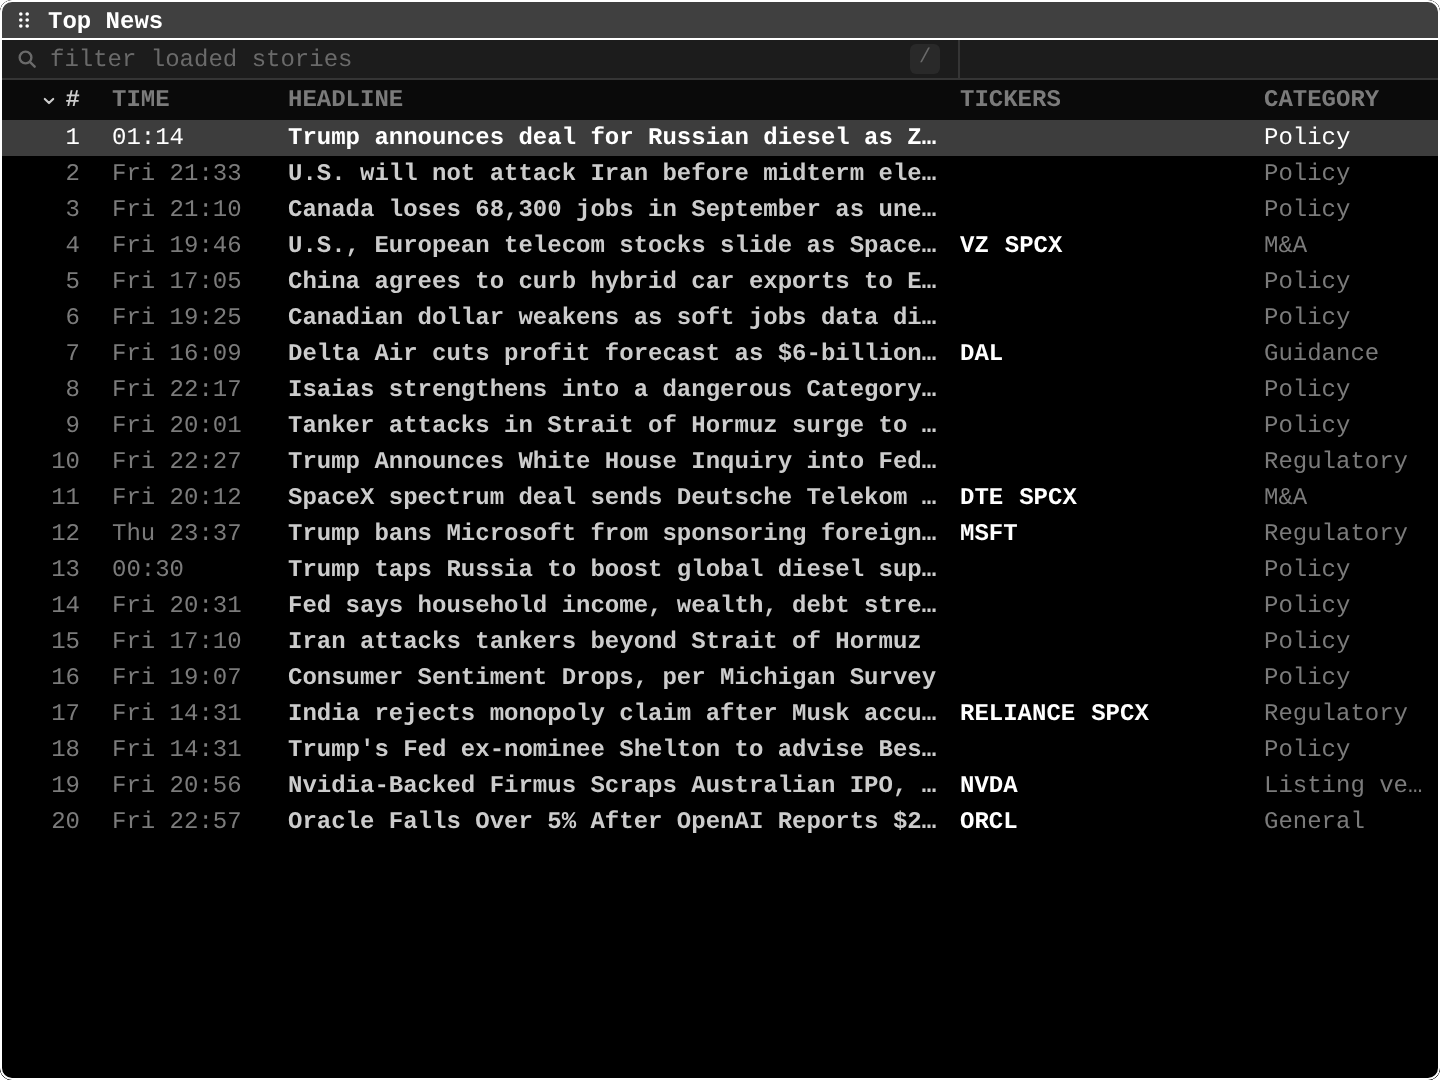
TOPTop news
Ranked market storiesCurated stories ranked by importance across wires, publishers, and X, with tickers and category. The pane to keep open when you only want what matters.
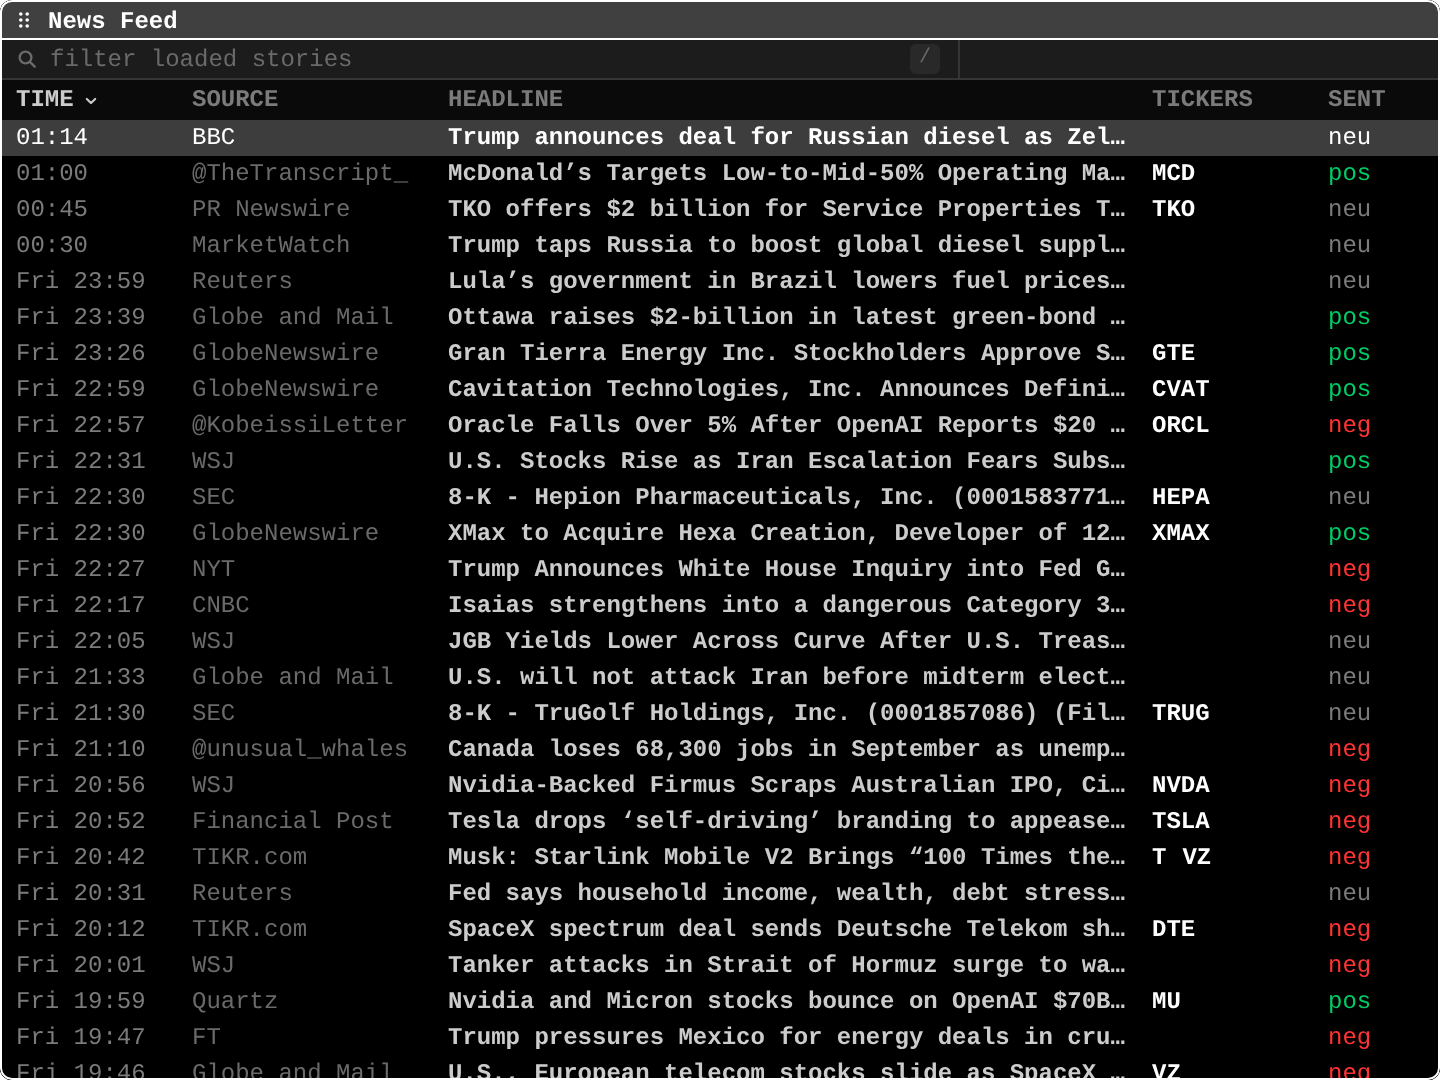
NNews feed
Chronological firehoseEvery story as it arrives, newest first, with source, tickers, sentiment, and importance score; filter by sentiment or minimum score. Add News Feed adds your own RSS feed (desktop and terminal, not web).
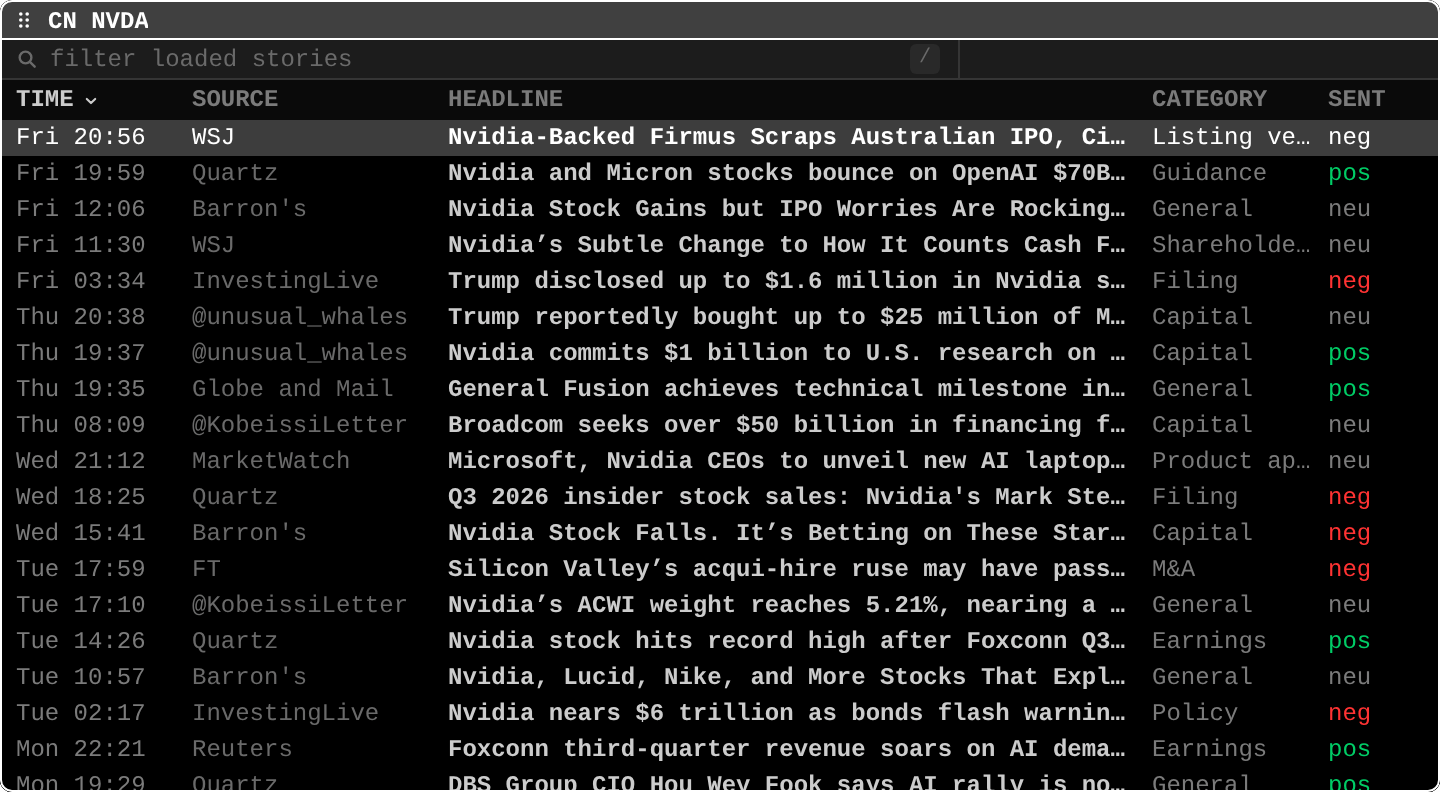
CNTicker news
News for one companyStories linked to the selected ticker, newest first.
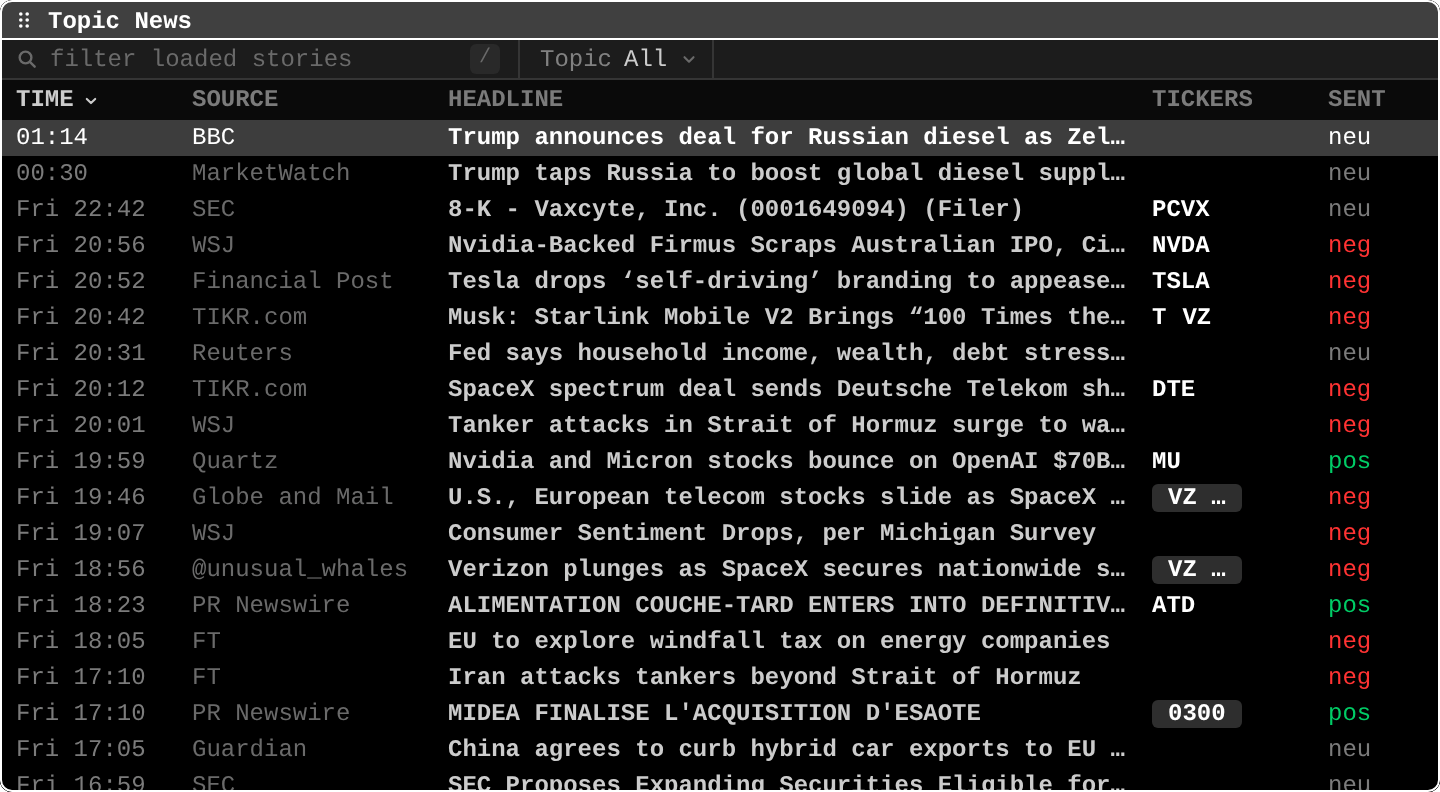
NITopic news
News by topic code or sectorMarket news by topic code (MNA, CB, ENERGY, METALS, REG, CRYPTO, EARN, IPO) or by sector. LTR lists public fund and investor letters as links to the publisher's page.
- Example
NI ENERGY - Learn it in the Academy: The news feeds (TOP, N, CN, NI, FIRST)
- Example
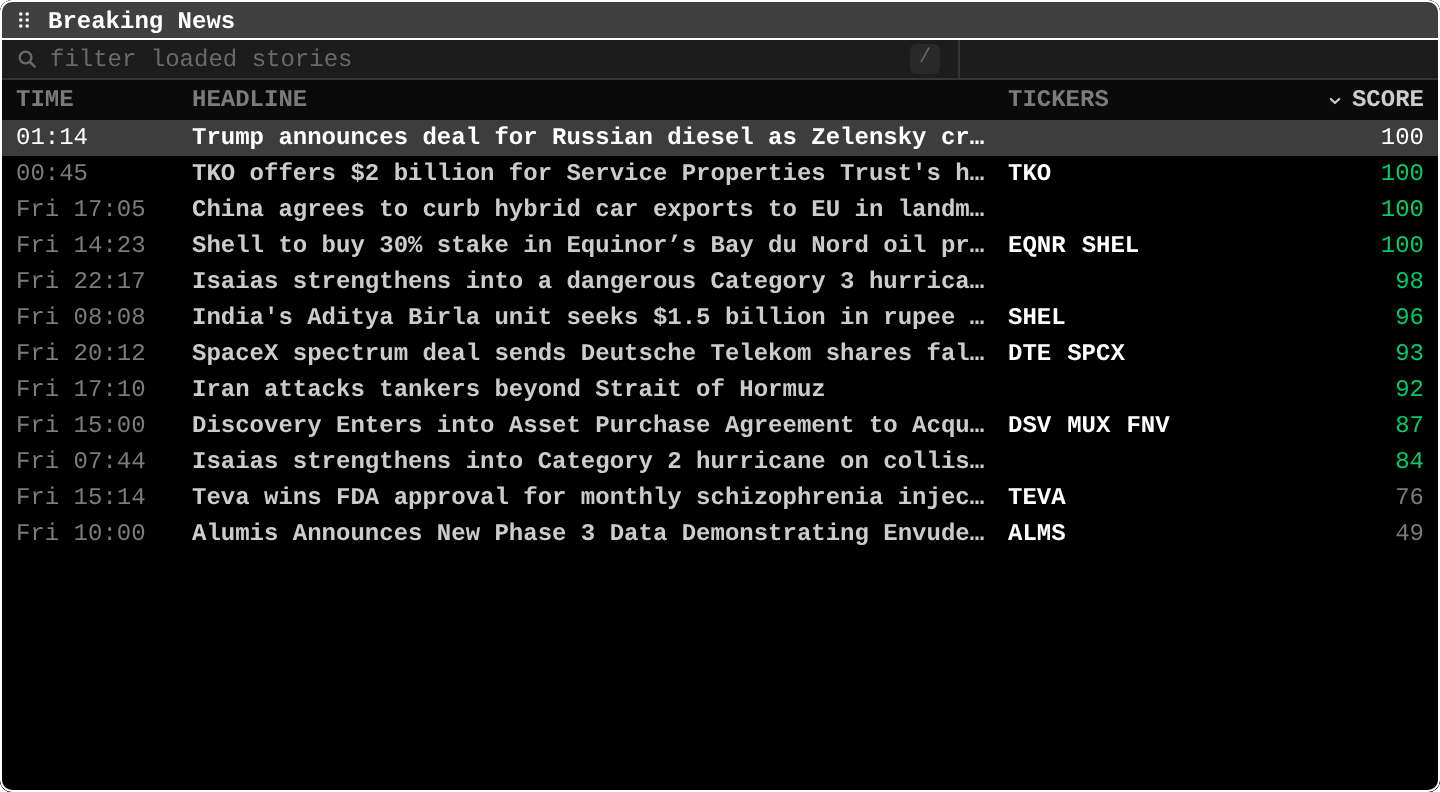
FIRSTBreaking news
Urgent stories onlyStories flagged as breaking or urgent. Turn on Notifications in its pane settings to hear about new ones even while the pane is closed.
TWITX feed
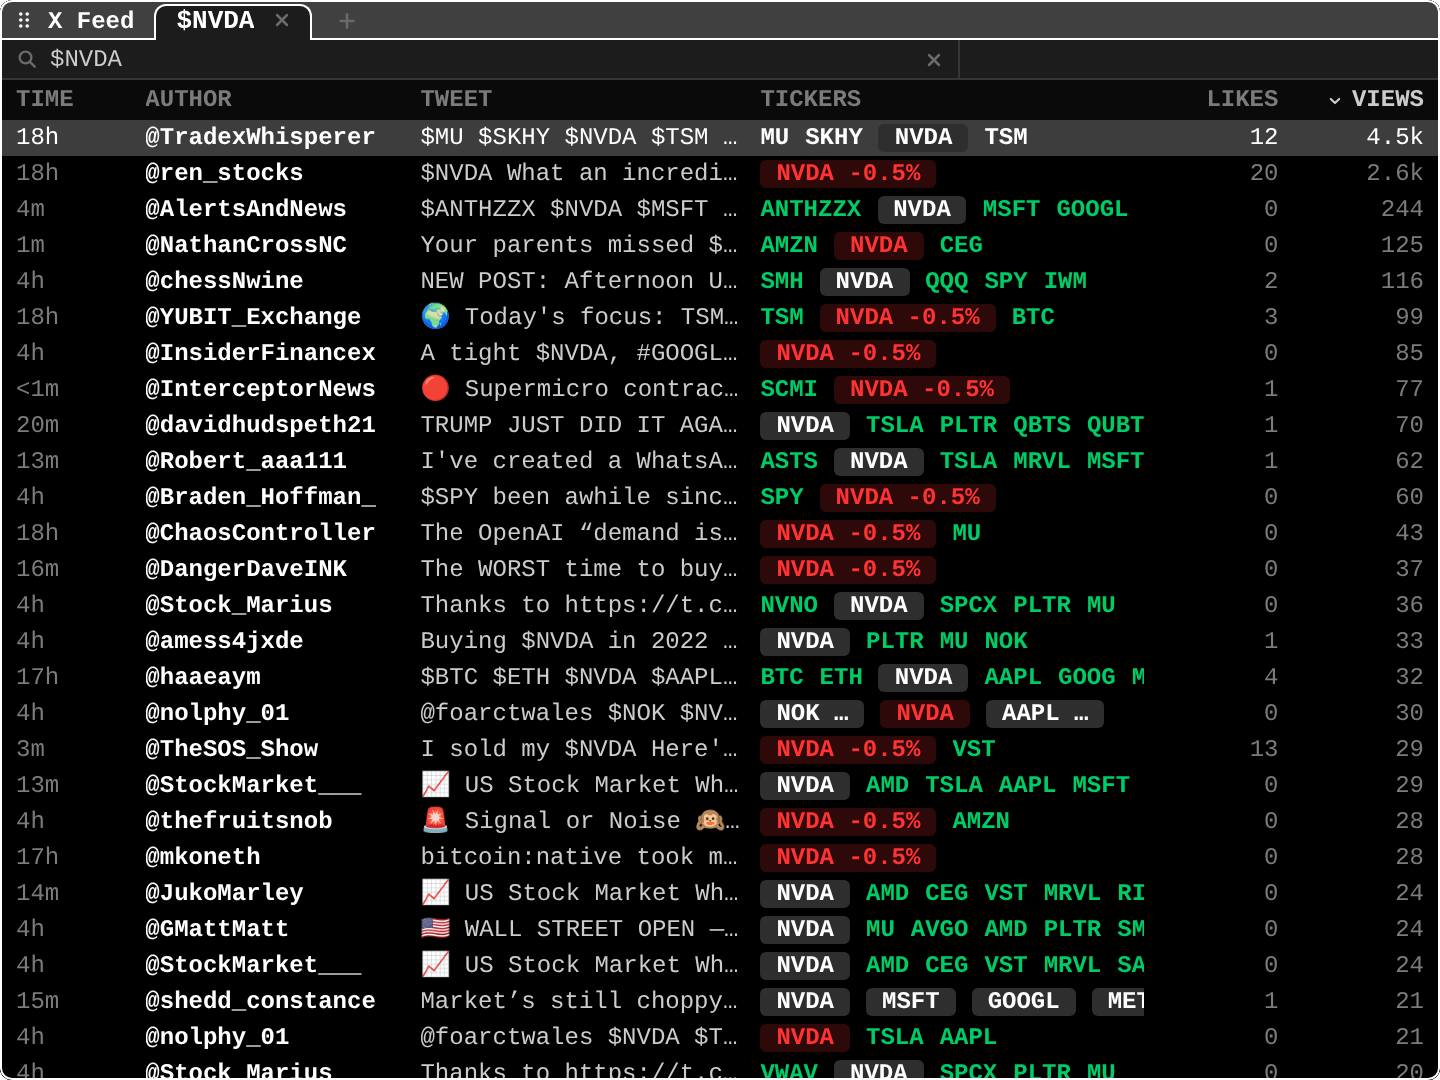
X search feedCloudAn X advanced-search feed for any ticker or query with likes and views, refreshed live. Needs a verified email.
- Example
TWIT $NVDA - Learn it in the Academy: Social posts, newsletters, TV and tech news (TWIT, SUB, TV, HN)
- Example
BUZZSocial mentions
Daily X posts naming a cashtagCloudDaily posts on X naming the ticker's cashtag, the day's top posts and their stance.
- Example
BUZZ TSLA - Learn it in the Academy: Social buzz (BUZZ)
- Example
SUBSubstack
Substack inboxPluginYour Substack subscriptions as a reader feed inside the terminal, signed in with your own account.
TVLive TV
Live financial TV channelsPluginLive financial television in a pane (desktop and terminal with a capable renderer).
HNHacker News
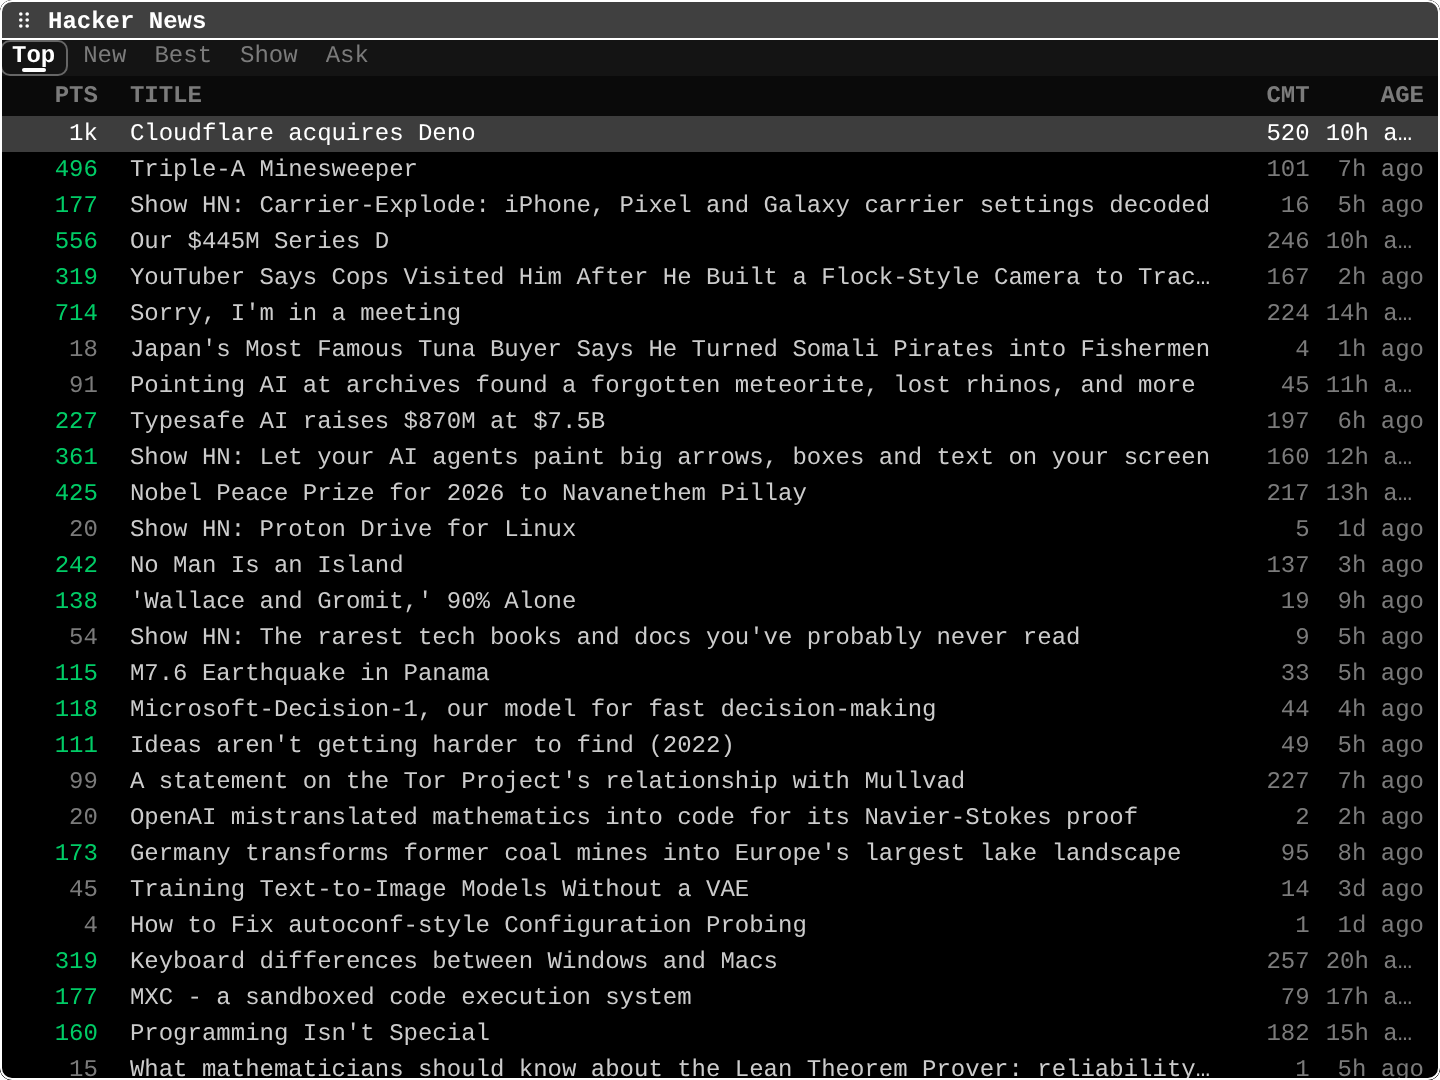
HN front pagePluginTop, New, Best, Show, and Ask with scores and comment counts. Also the reference plugin if you want to write your own.
- Plugin: Hacker News
- Learn it in the Academy: Social posts, newsletters, TV and tech news (TWIT, SUB, TV, HN)
Watch markets
31The tape at a glance.
MOSTMarket movers
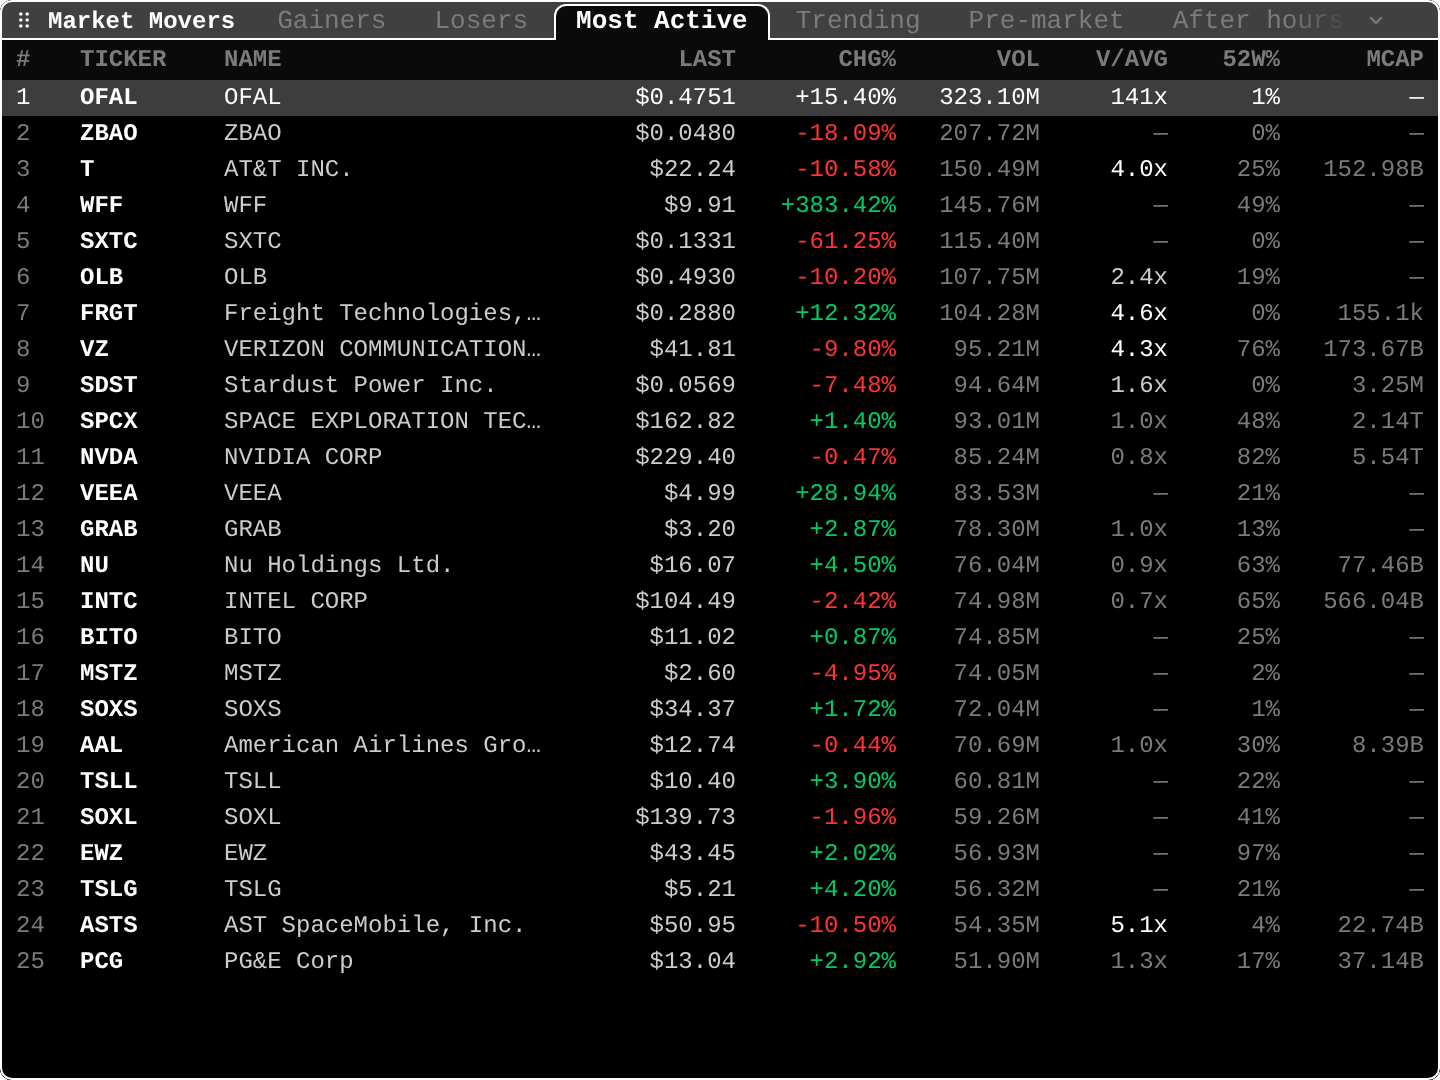
Gainers, losers, pre-market, gapsToday's top gainers, losers, most active and trending tickers with price, change, volume against average and market cap, and the pre-market and after-hours movers. Pro adds the gaps at the open.
WEIWorld equity indices
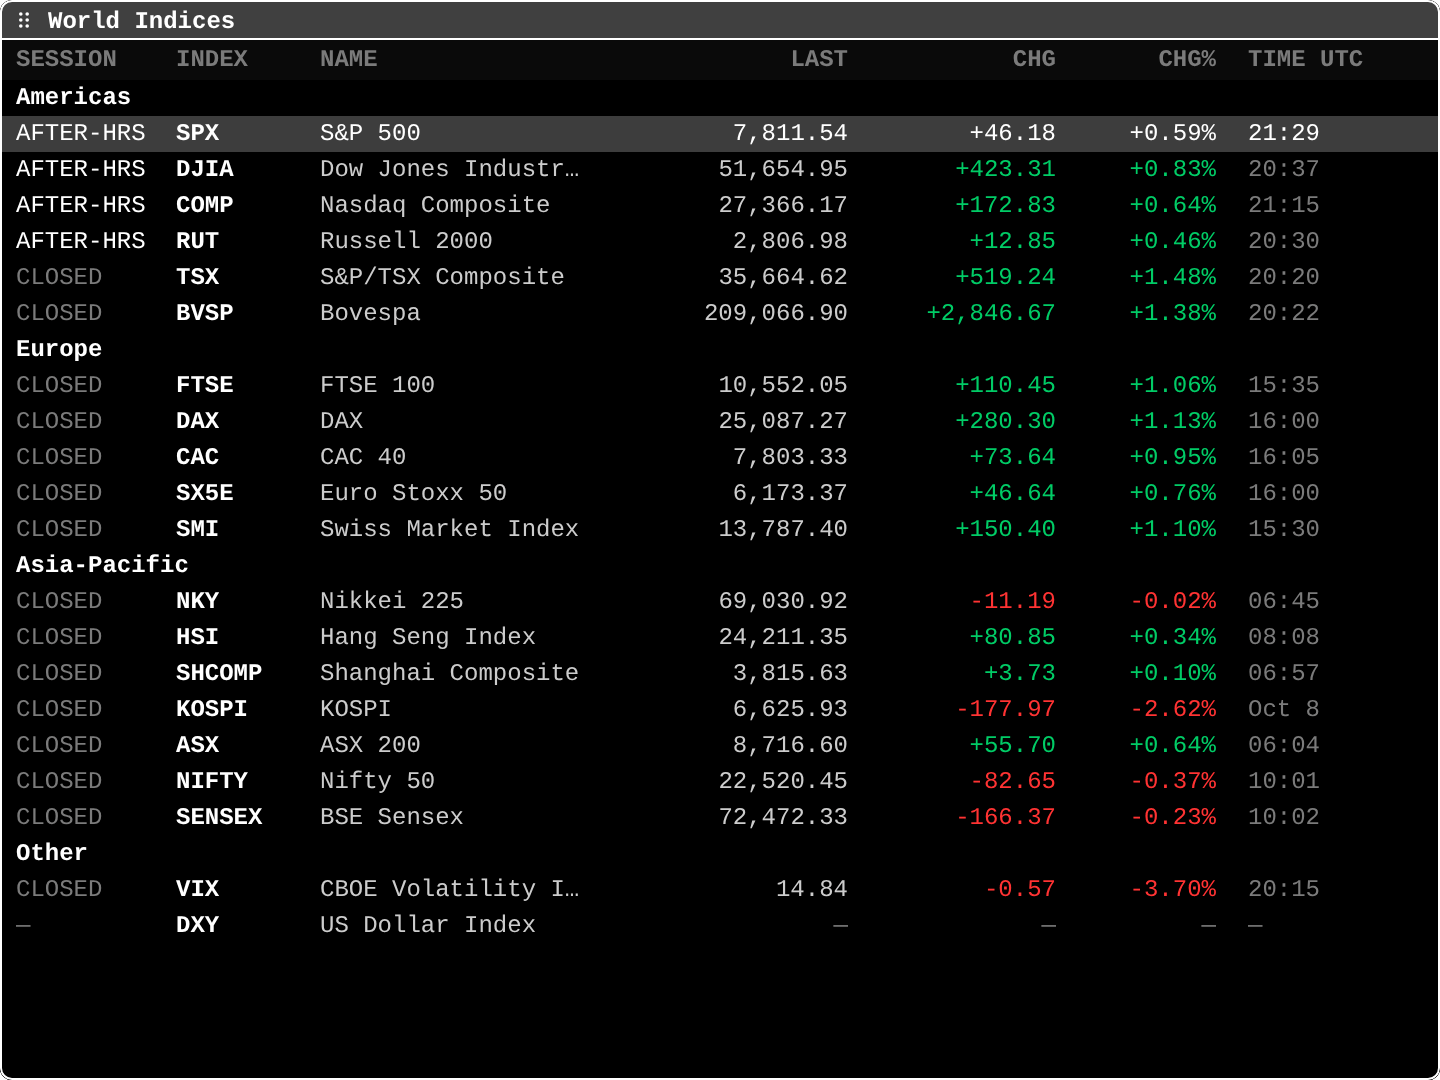
Global indices by regionMajor indices grouped by region with last, change, and session status, so you can see which markets are open and how they closed.
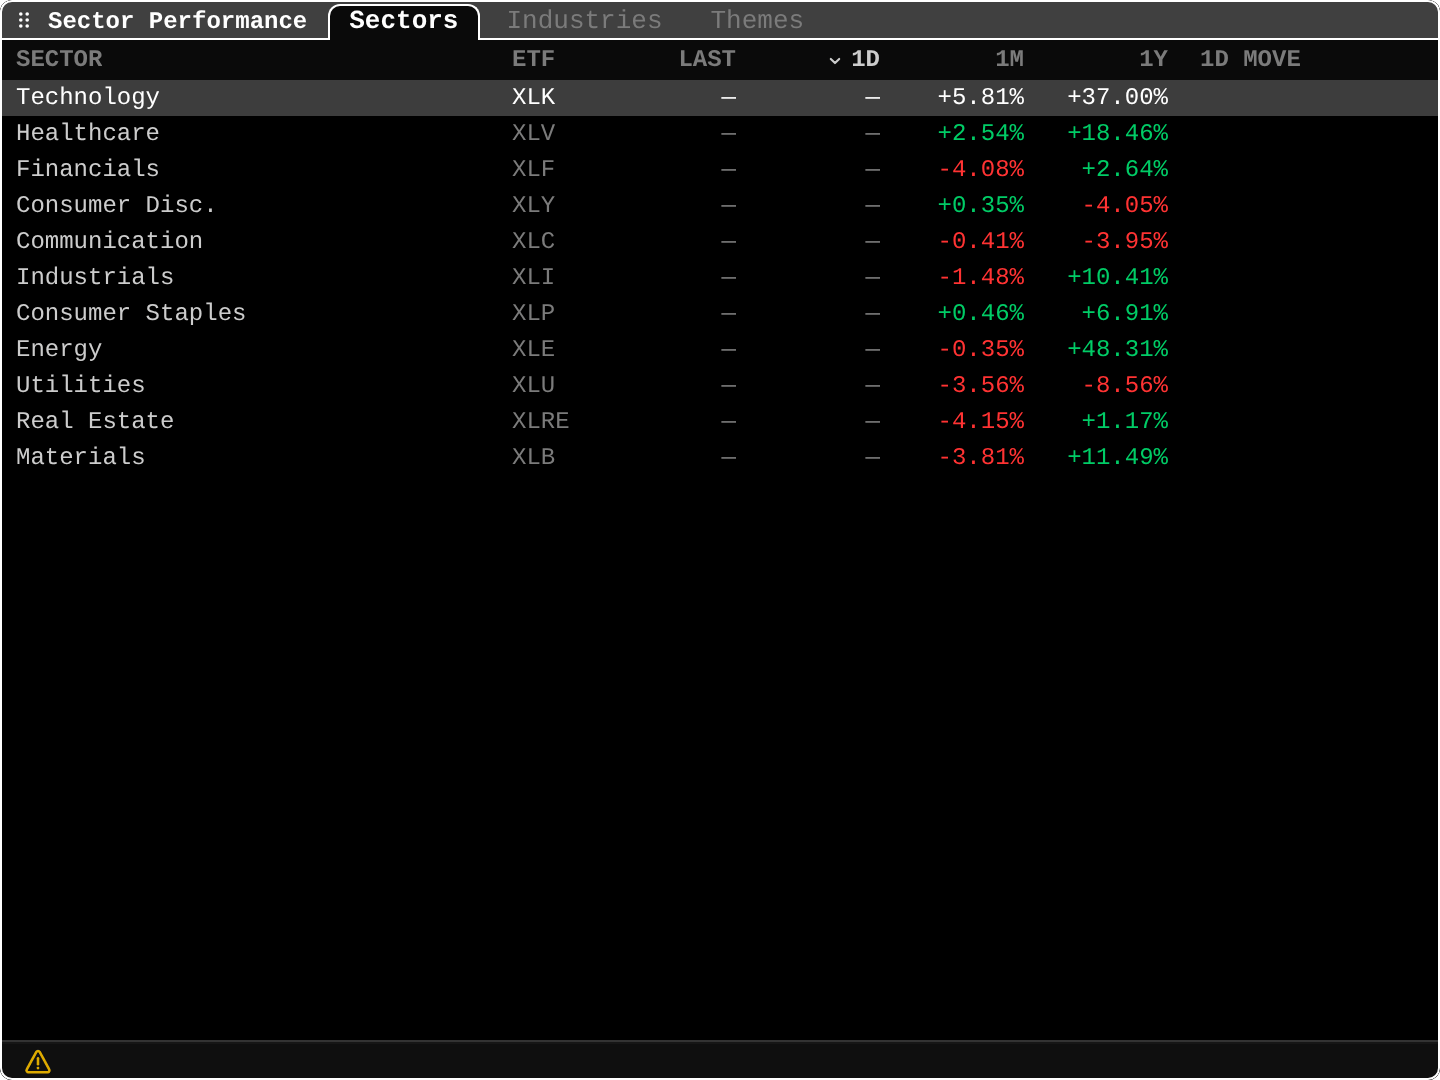
BISector performance
S&P sectors by daily changeS&P 500 sectors and industries sorted by the day's move, with their representative ETFs.
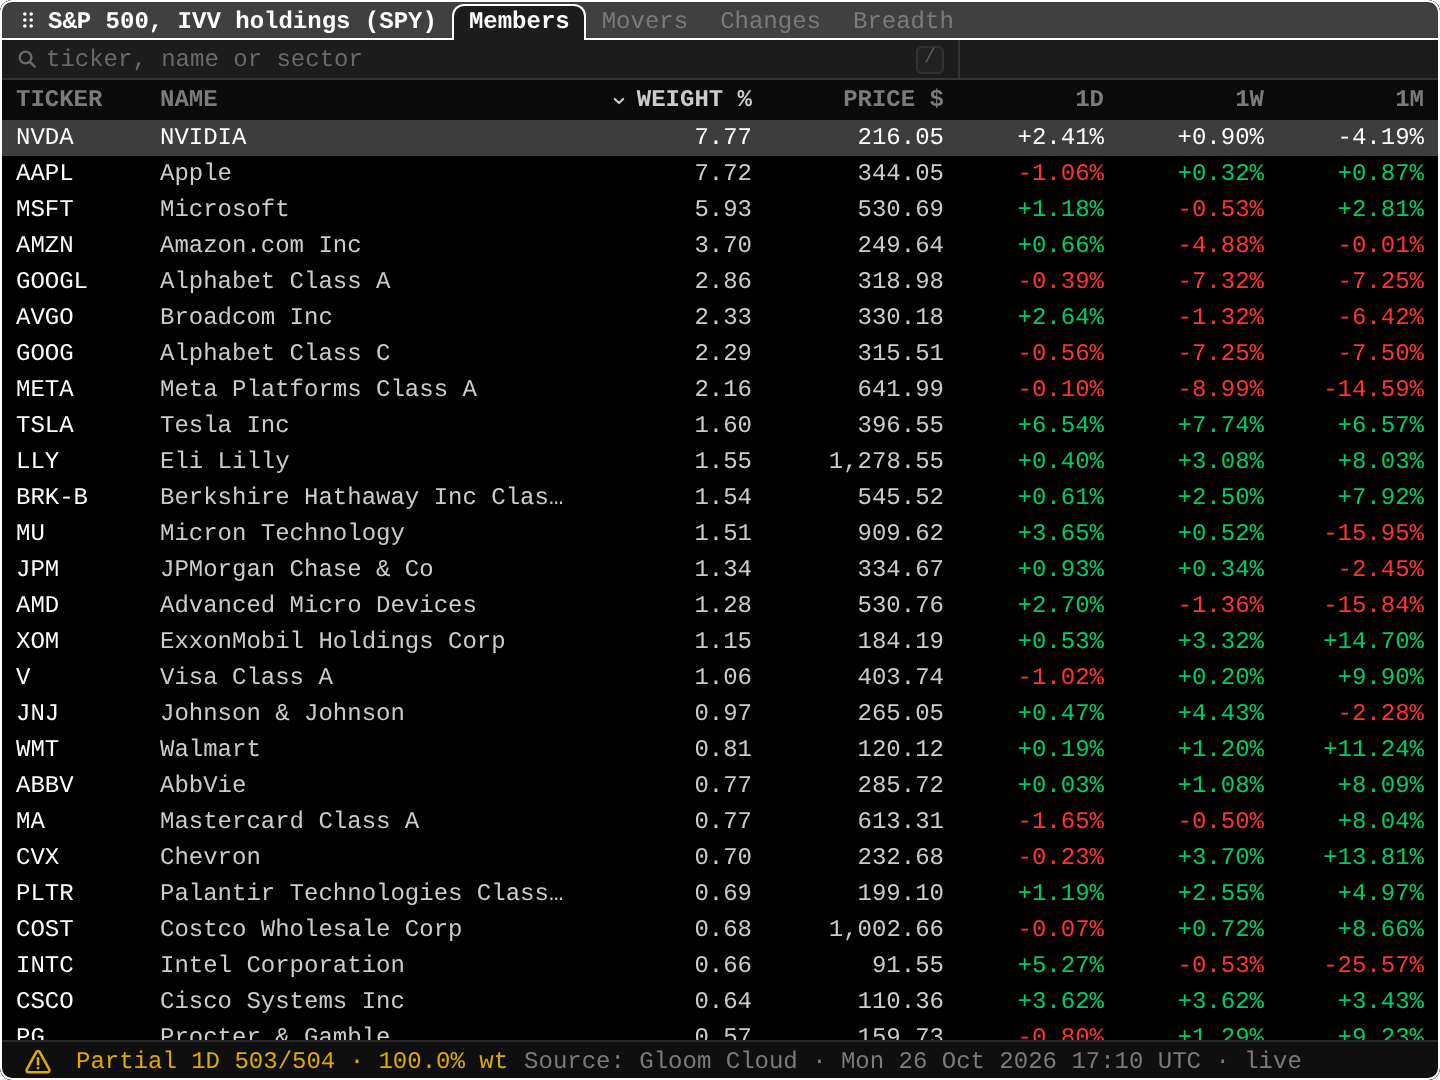
MEMBIndex and ETF members
ETF holdings, member returns and index changesIVV, IJH, IJR, IWM and IWB holdings with weights, member returns, daily contributions and index changes. SPX and SPY use IVV holdings.
- Example
MEMB SPY
- Example
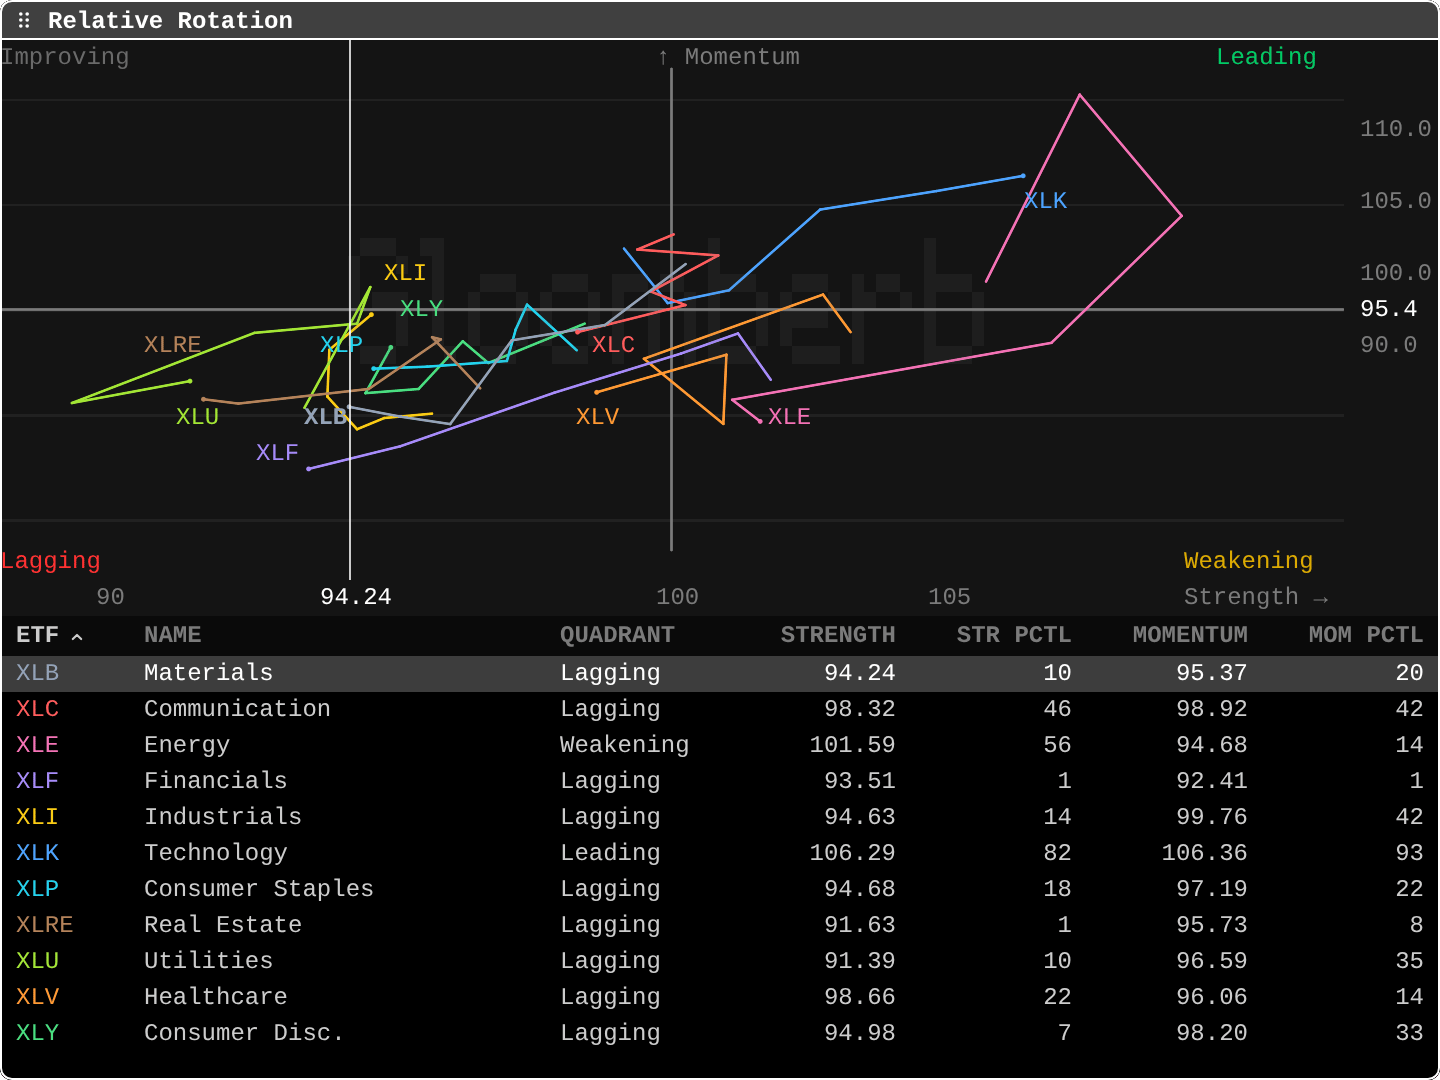
RRGRelative rotation
Strength vs momentumEach name's strength against SPY or another benchmark, plotted against its momentum with weekly trails through the four quadrants. Sector ETFs by default, or your tickers. GRR opens it too.
- Example
RRG NVDA, AAPL, MSFT - Learn it in the Academy: Sectors, themes and rotation (BI, THEM, RRG)
- Example
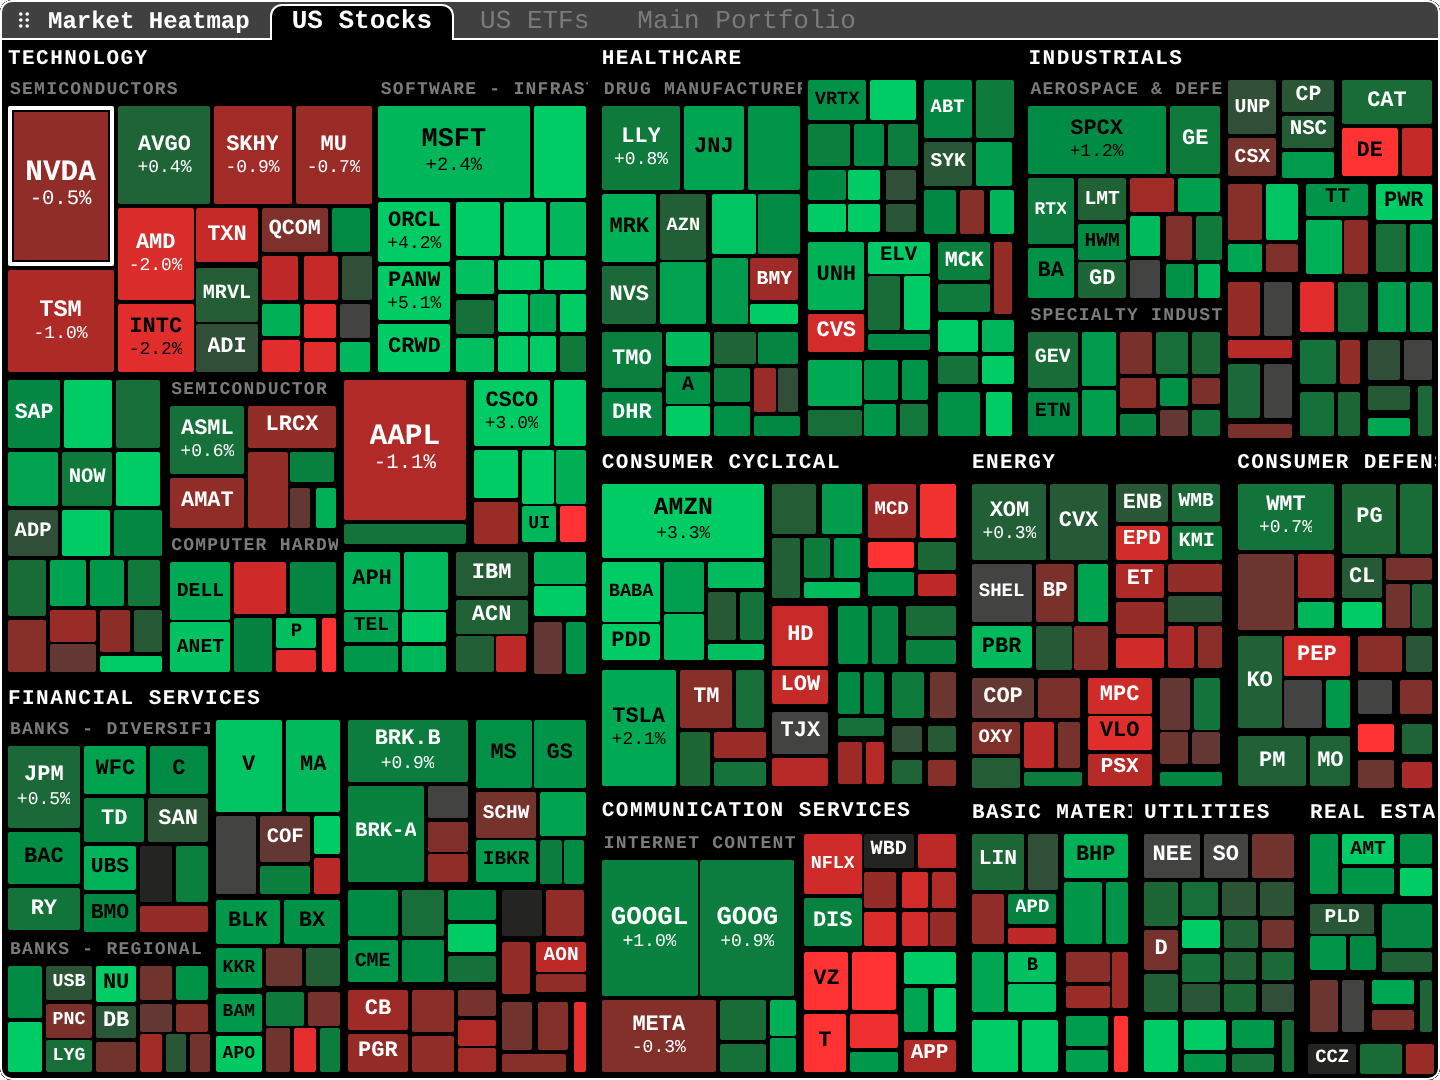
HMMarket heatmap
Cap-weighted heatmapThe 500 largest US stocks grouped by sector and industry, or the largest ETFs, as a treemap colored by the day's move and moving with live quotes. Sized by the square root of market cap, or by market cap itself.
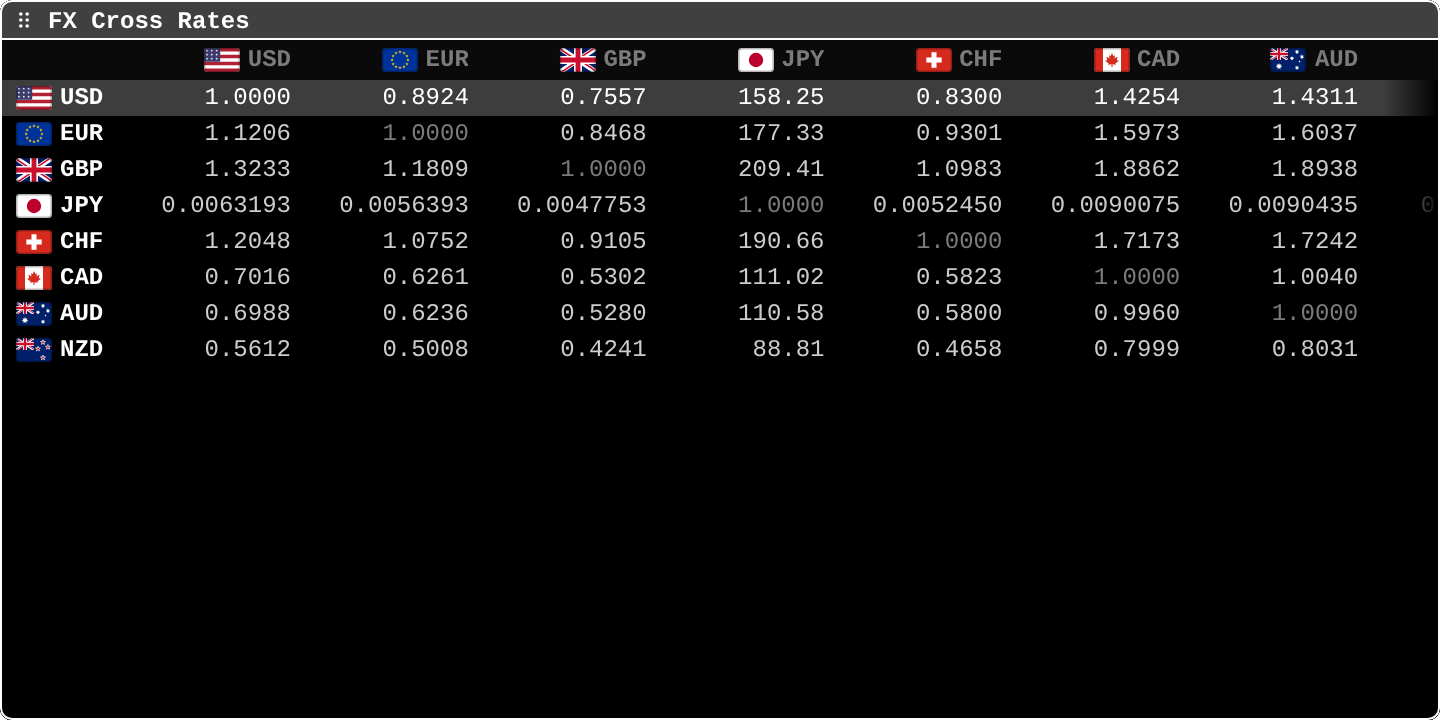
FXCFX cross rates
Currency cross matrixA cross-rate matrix for the major currencies, updated live.
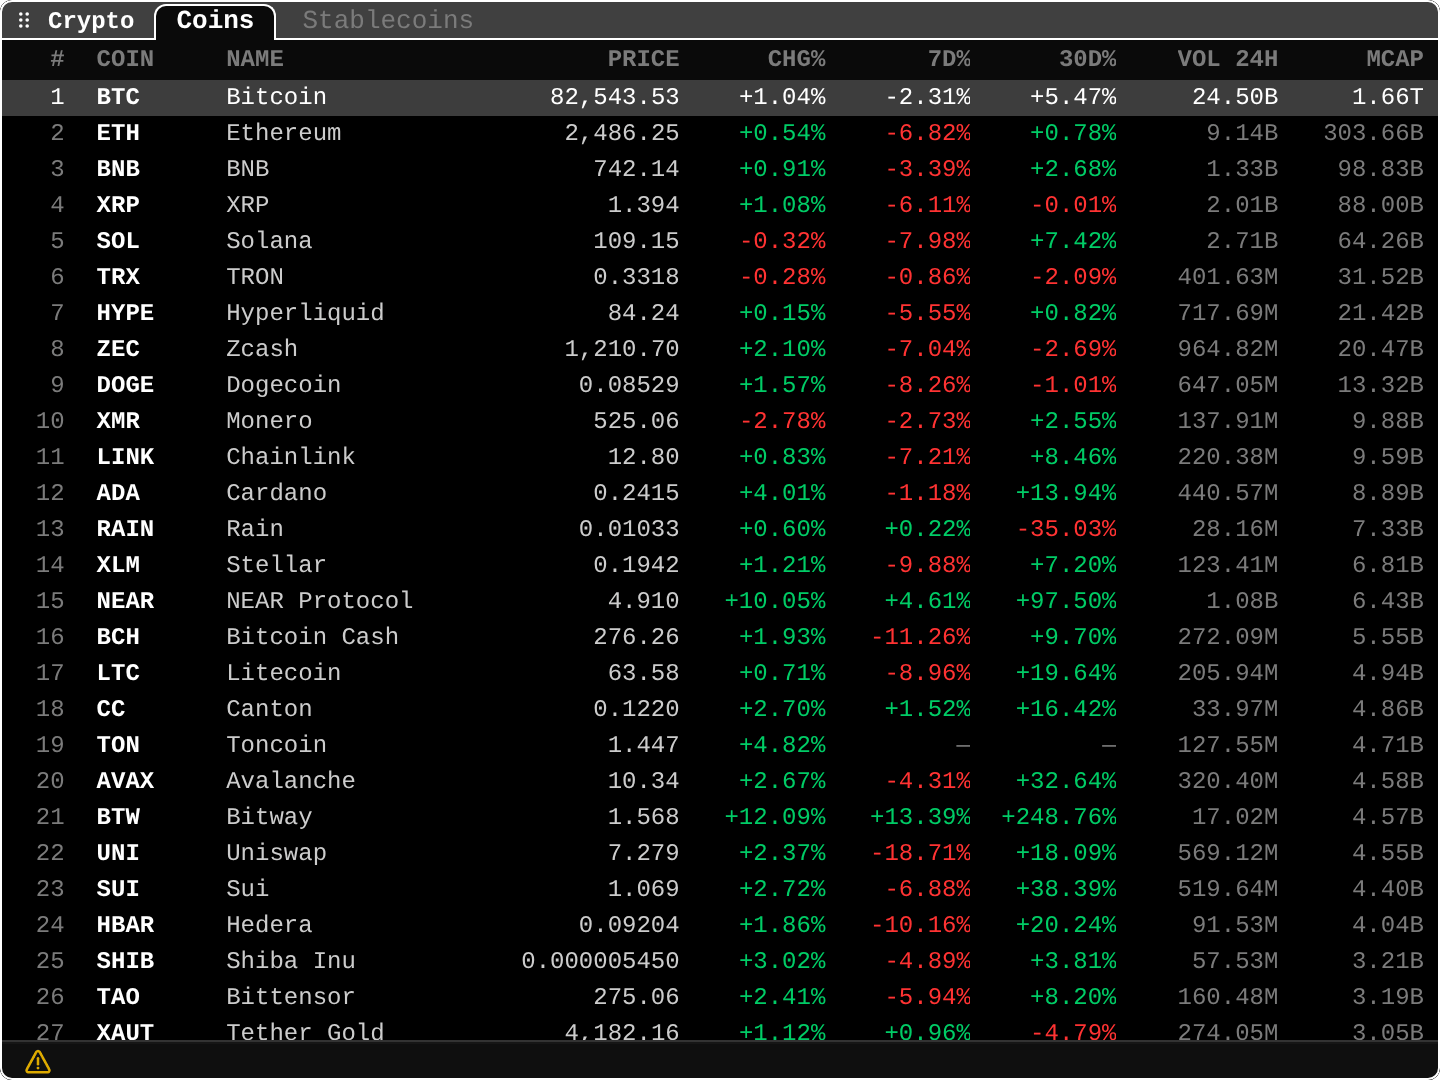
CRYPCrypto board
Top coins by market capThe top 100 coins by market cap, with returns from a day to a year, a 30-day sparkline, volume, and market cap. Stablecoins have their own tab: total supply over time stacked by coin, and each coin's supply, 7- and 30-day supply growth and share of the total. Prices stream live on every plan where the market allows.
ETFFCrypto ETF flows
Daily spot bitcoin and ether ETF flowsDaily net flows of the US spot bitcoin and ether ETFs, fund by fund in US$ millions, as Farside Investors publishes them: the last 5 and 20 days, the running total since launch, and the funds the newest day still waits on.
PERPPerpetual history
Funding, open interest and premium historyProFunding, open interest and premium history for one perpetual on Hyperliquid, Binance, Bybit or OKX, with each reading's source. Pro shows the history; Free a limited preview. Live board and trading are in the Hyperliquid plugin.
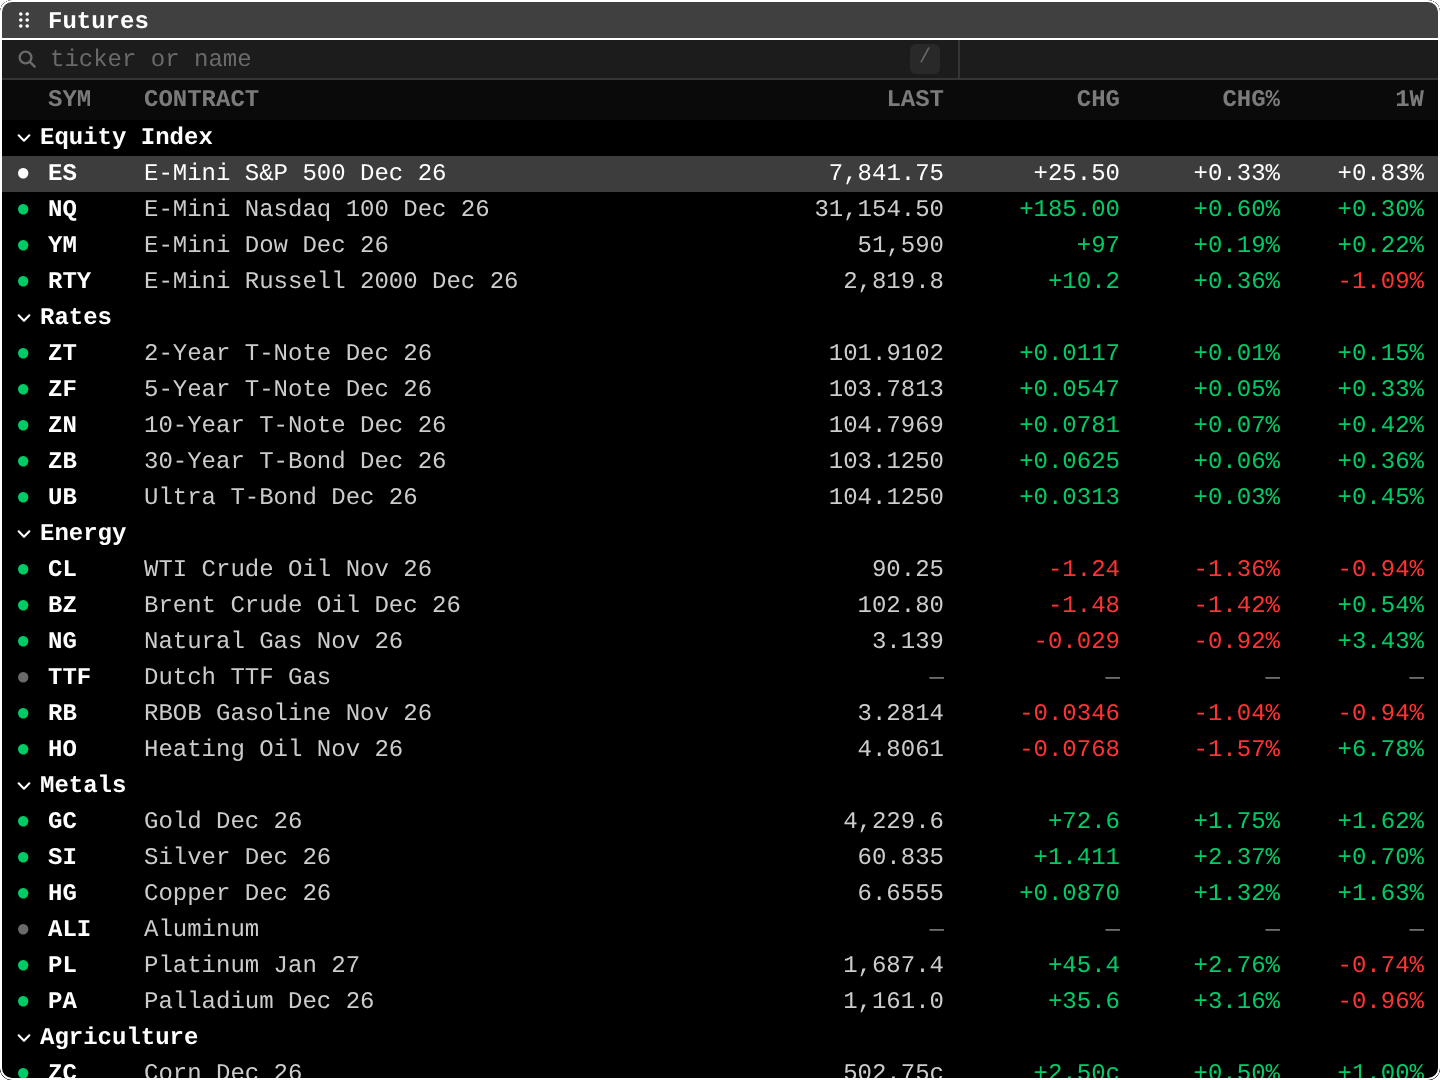
FUTFutures board
Front-month futuresEach root's front contract until its stated roll date across equity index, rates, energy, metals, agriculture, and FX with last price, unit and session change, grouped by sector, naming the day's most active month by volume when it is another one.
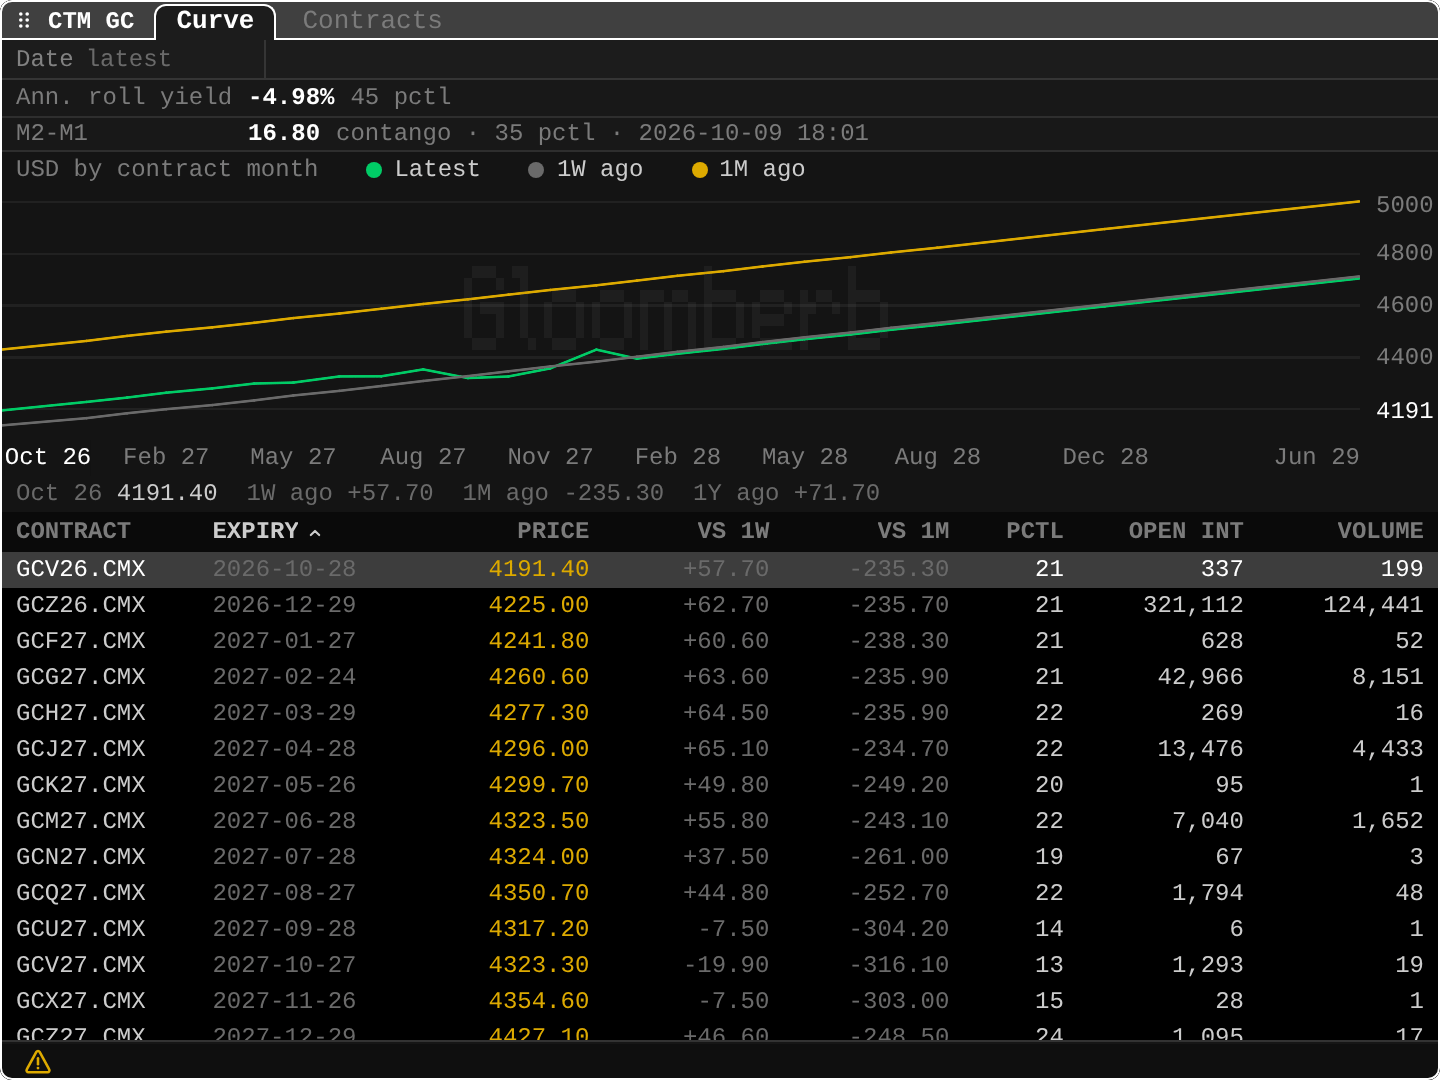
CTMFutures curve
Futures term structureA futures root's listed contracts as a curve against a week and a month ago, with roll yield, contango or backwardation, and each contract's price, open interest, and volume.
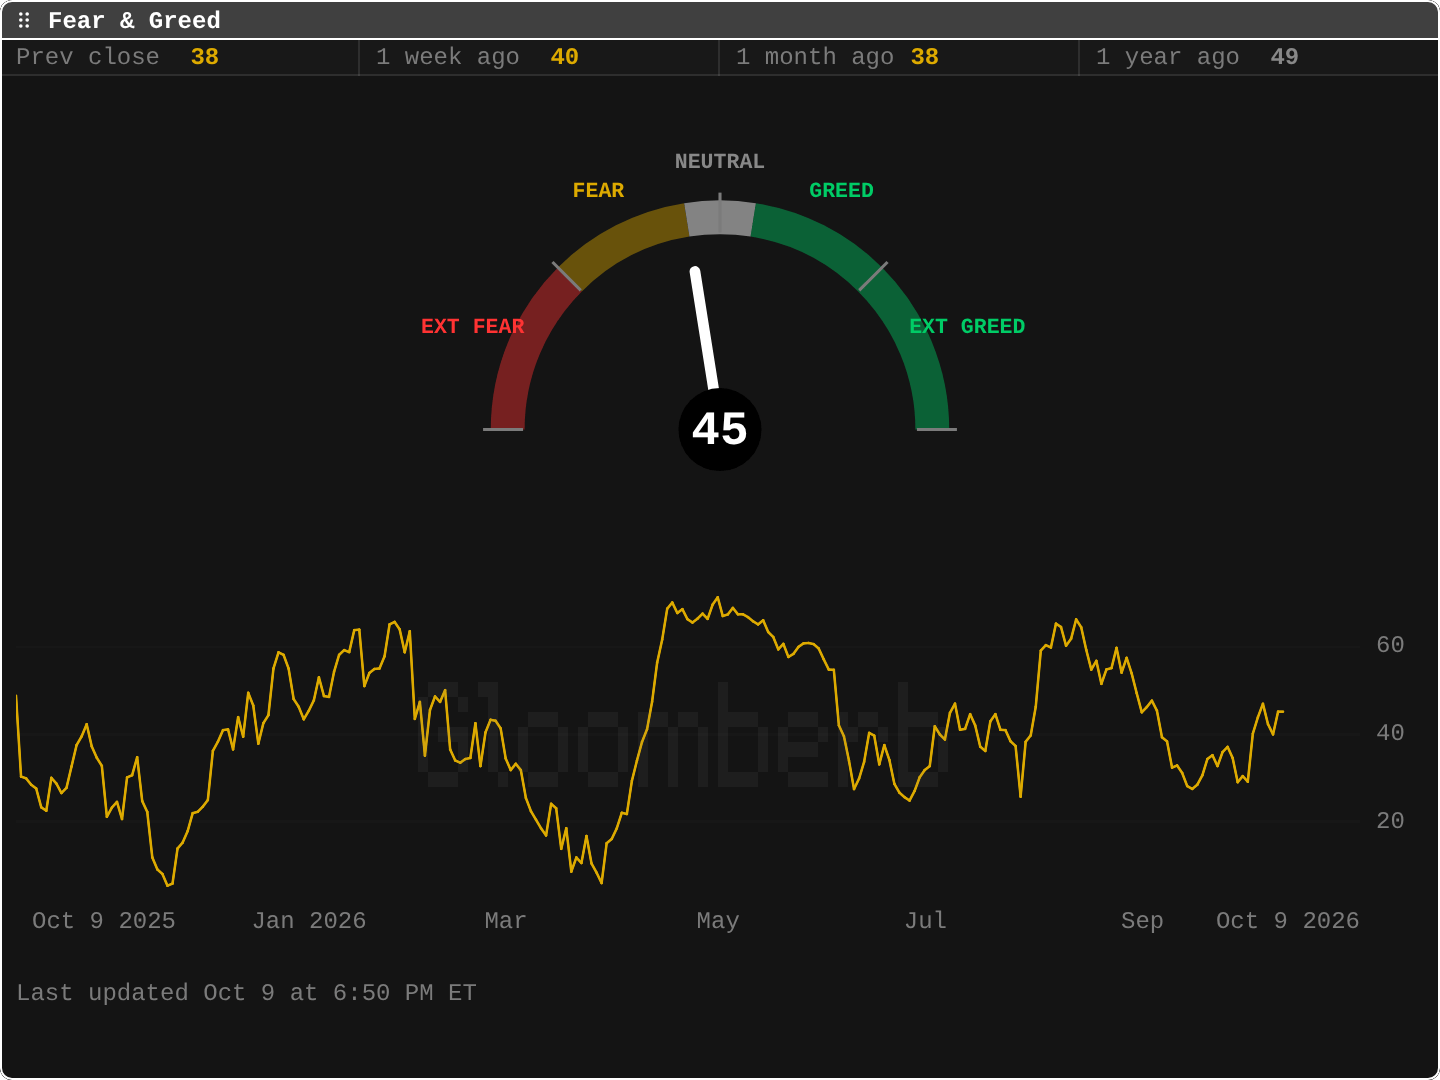
FNGFear and greed
CNN sentiment gaugeThe CNN Fear & Greed index with its history and each of the seven component indicators.
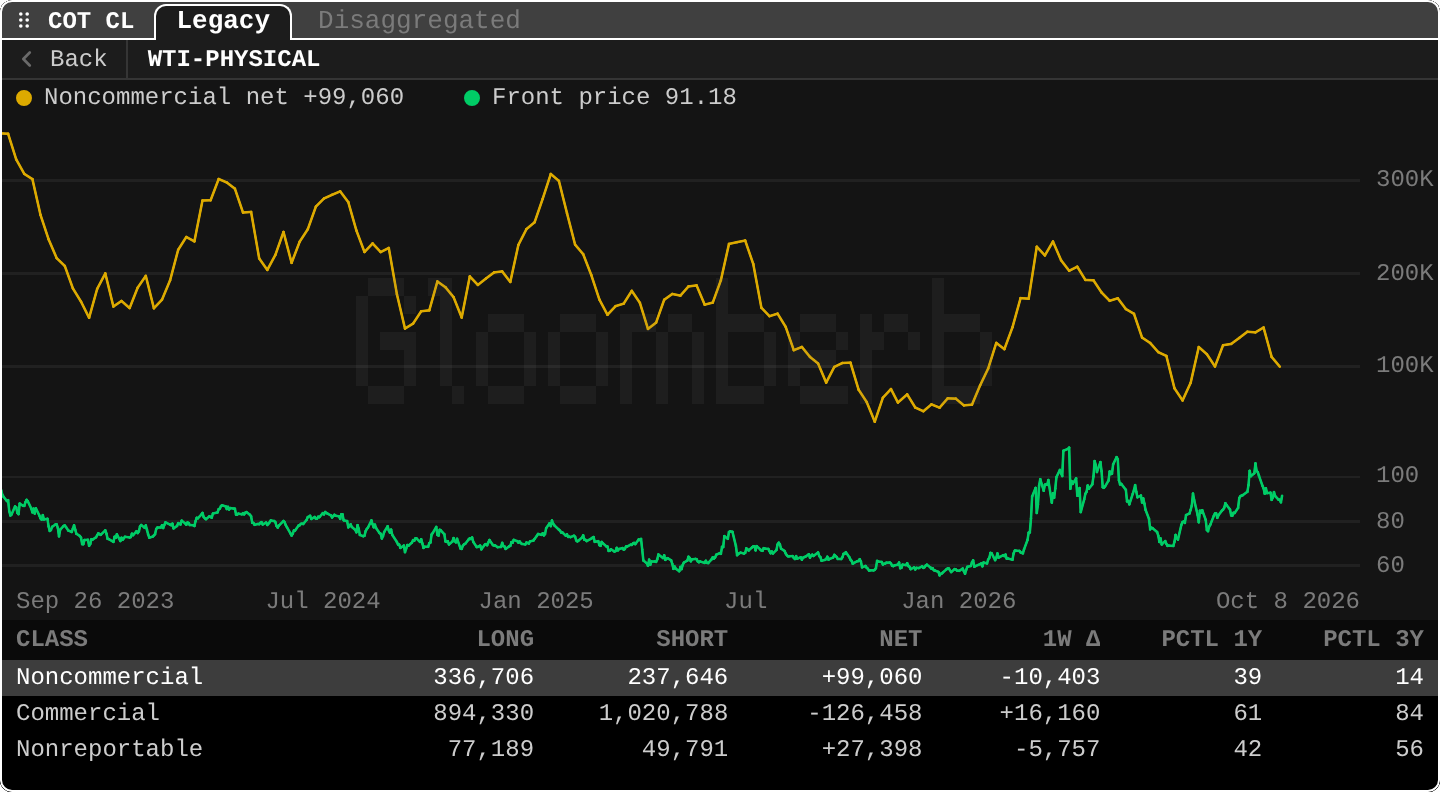
COTCFTC positioning
Commitments of TradersWeekly CFTC Commitments of Traders: net positioning by trader class, the weekly change, and one- and three-year percentiles. Pass a root like CL to chart it under the front-month price. CFTC opens it too.
- Example
COT CL - Learn it in the Academy: Who holds the futures (COT)
- Example
POWERPower and grid buildout
Grid queues and large loadsProGrid interconnection queues, datacentre and other large-load requests, generation capacity and utility exposure, with a link to the source for every project. Pro shows the full data and history; Free shows three rows per section. EPWR opens the Prices tab, free: day-ahead power prices for 32 European markets in EUR/MWh and the EU carbon (EUA) auction clearing price in EUR/tCO2, each with its daily history. EPWR GAS shows European gas storage from GIE AGSI+: % full, TWh and daily injection and withdrawal for the EU and each member state, against a year ago and the five-year range.
- Example
POWER NEE - Learn it in the Academy: Power and the grid (POWER)
- Example
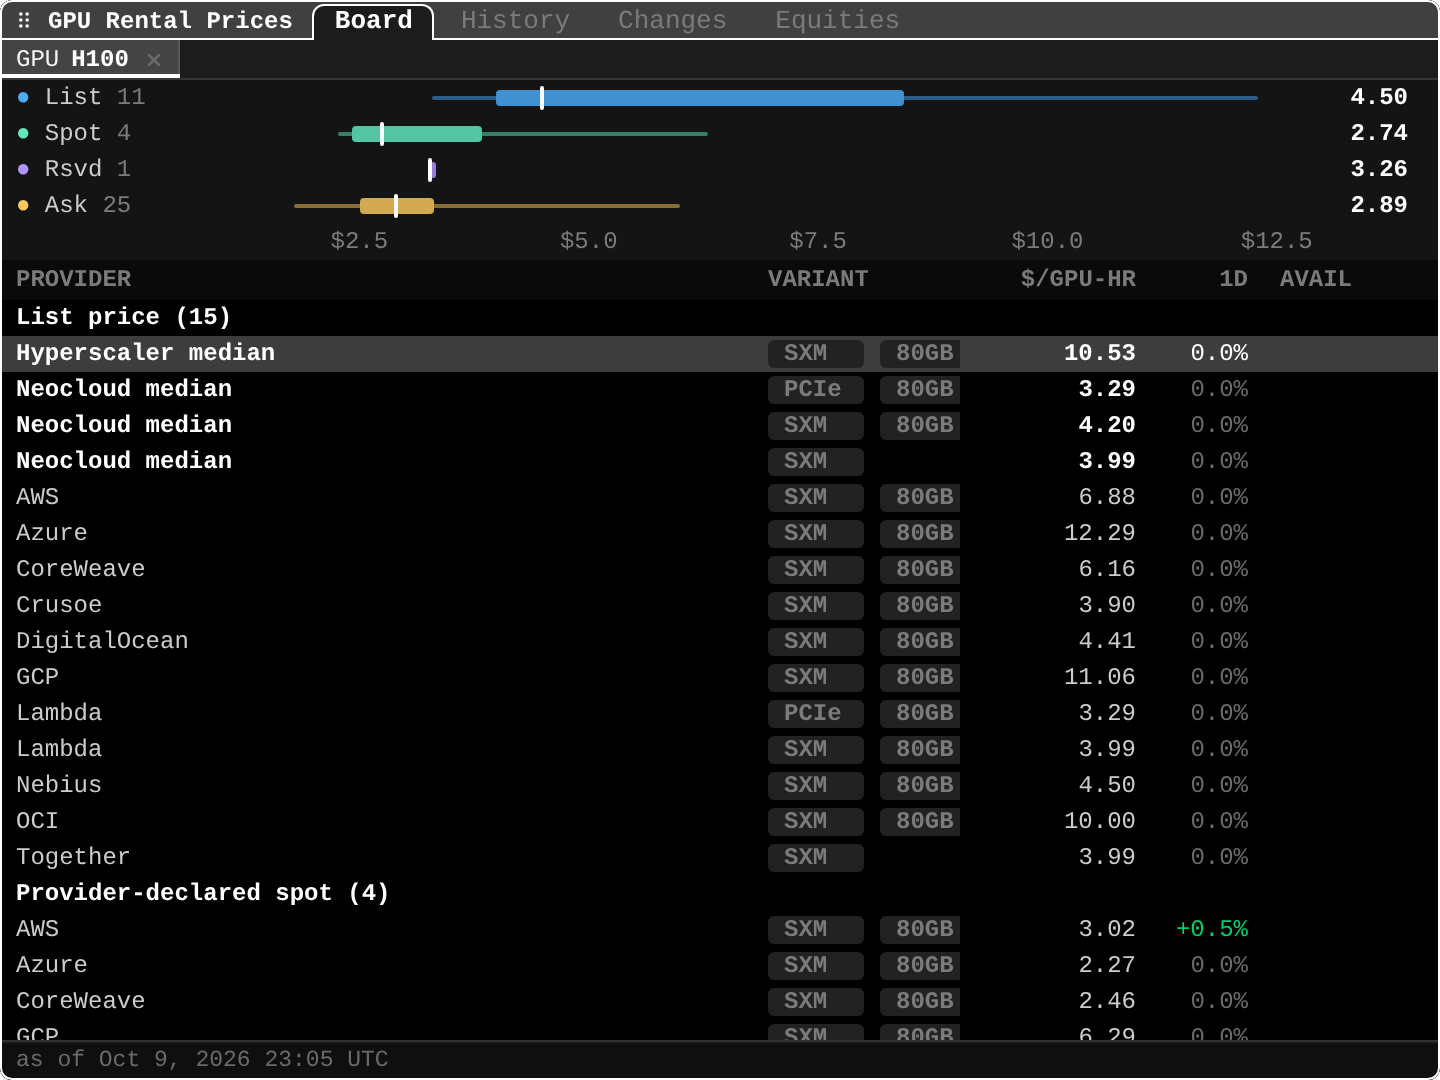
GPUGPU Rental Prices
GPU rental rates and asksProWhat it costs to rent a GPU by the hour: published prices, spot rates and marketplace asks in USD per GPU-hour, with history and related equities. Pro shows the full board; Free shows a three-row sample led by H100, B200 and H200.
- Example
GPU H100 - Learn it in the Academy: GPU rental prices (GPU)
- Example
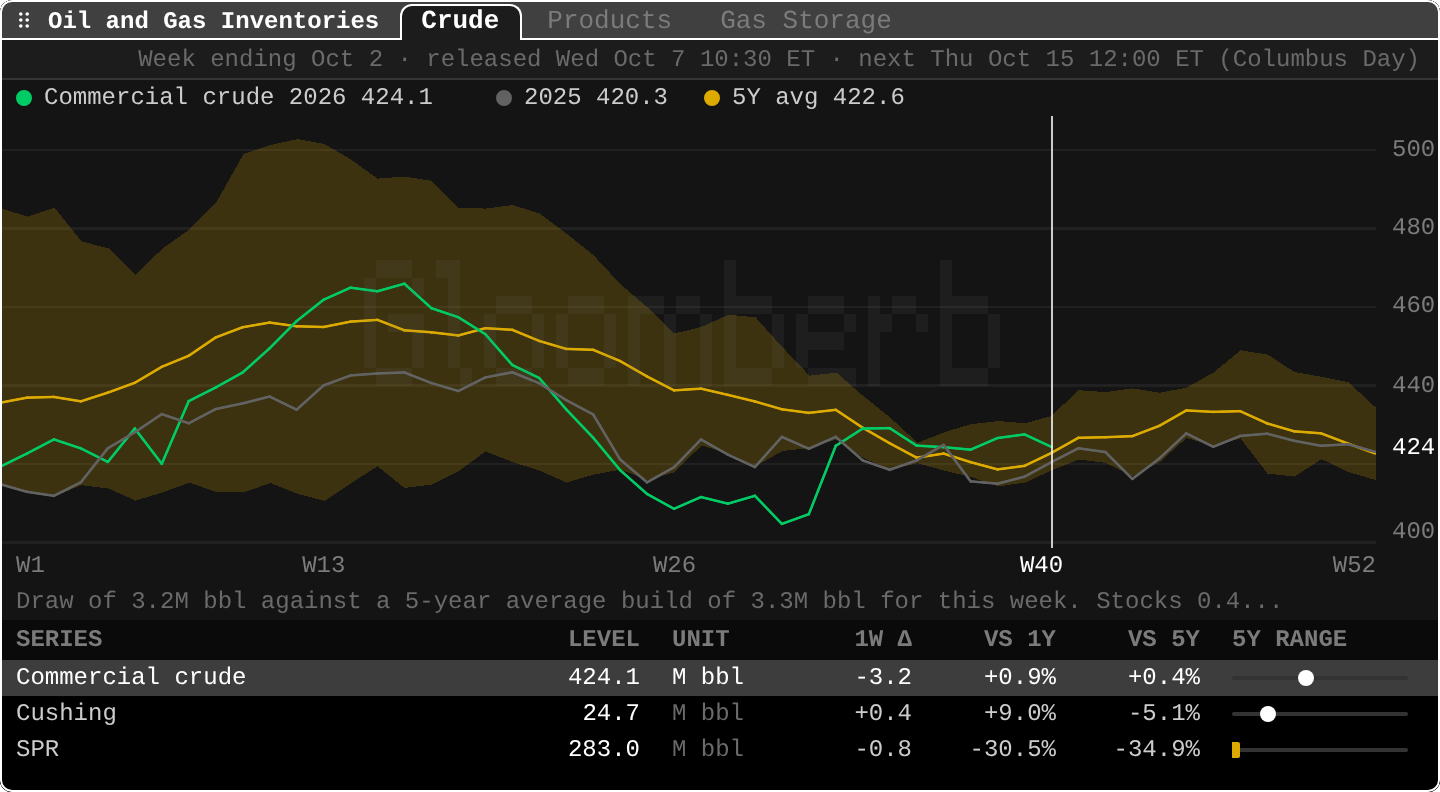
DOEOil and gas inventories
EIA weekly stocks and storageThe EIA's weekly oil and natural gas storage: crude, Cushing, the SPR, products and gas by region, each with the week's build or draw and its place in the five-year range. NGS opens the gas tab.
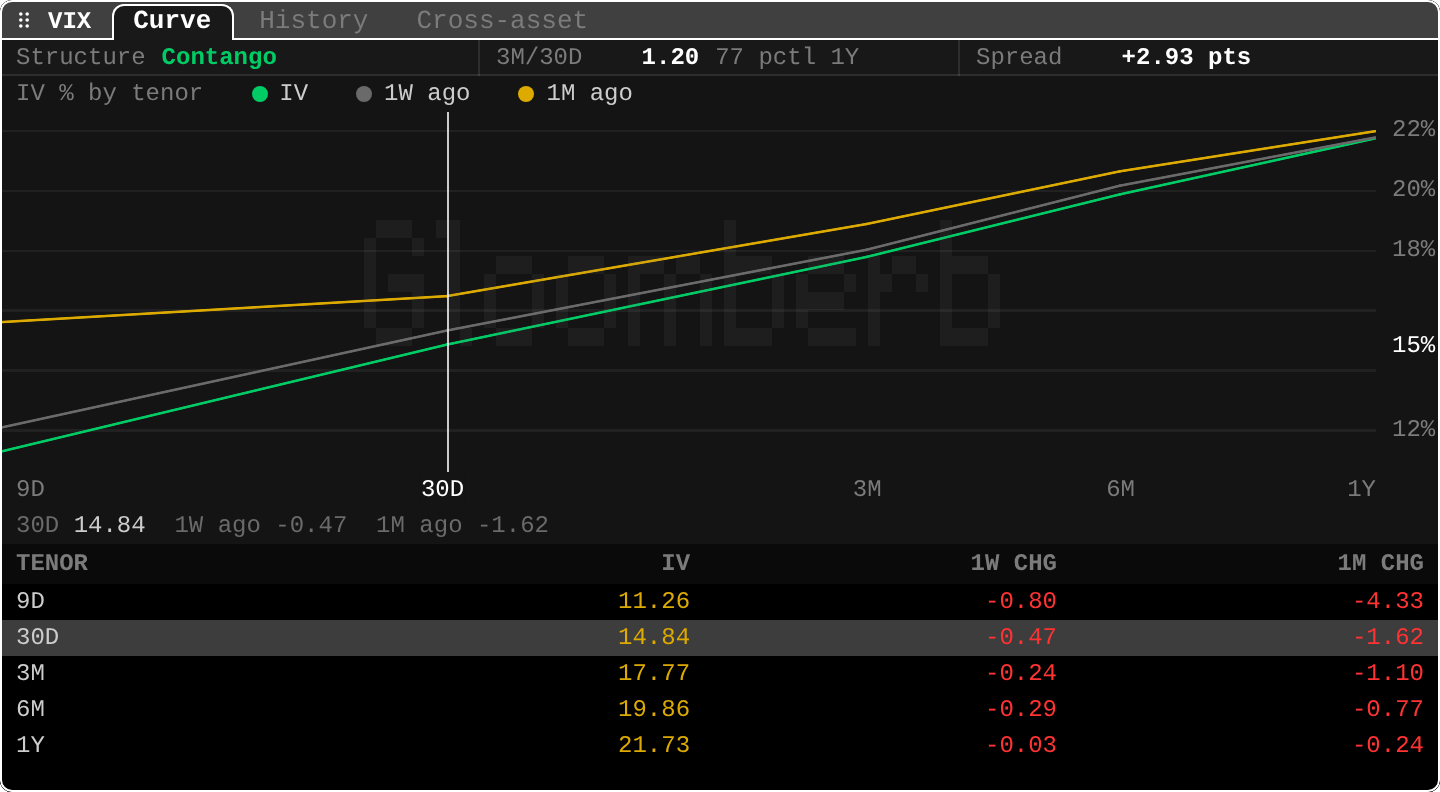
VIXVIX term structure
30-day vs 3-month VIXDaily 30-day and three-month VIX closes from FRED, so you can see whether the curve is in contango or inverted.
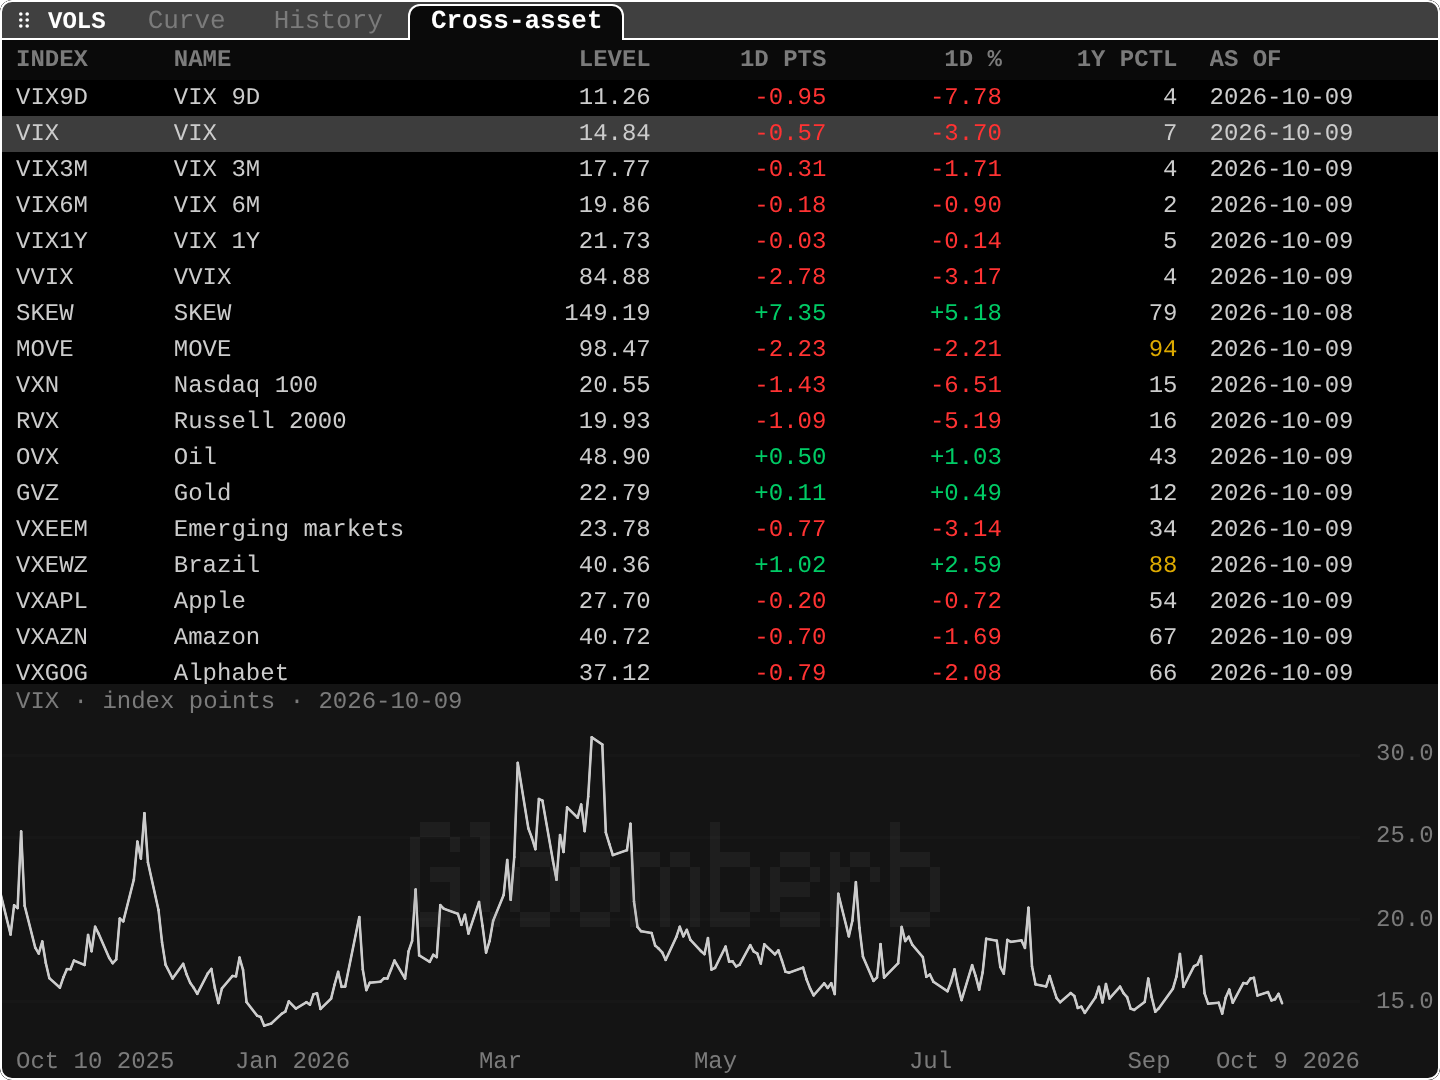
VOLSCross-asset volatility
Volatility index boardVolatility indices across assets on one board: the VIX term, VVIX, SKEW, MOVE, and index, commodity, and emerging-market vol, each with its one-year percentile. The Cross-asset tab of VIX.
HILONew highs and lows
Session highs and lowsA live count of stocks printing new session highs and lows over 30-second, one-minute, and five-minute windows. Real-time on Pro, 15-minute delayed on Free.
SCANLive scanner
Your own intraday stock scanScan all US stocks, an index, a sector or a watchlist for your own conditions: a move over the last minutes, volume against its usual pace, a new session high or low, a VWAP cross or a gap, above price, market cap and volume floors. Matches refresh through the session and new ones can alert. Real-time on Pro, 15-minute delayed on Free.
FLOWOptions flow
Unusual options activityProSweeps, blocks, and large premium prints, plus the session's net premium tide.
- Example
FLOW NVDA - Learn it in the Academy: Options flow (FLOW)
- Example
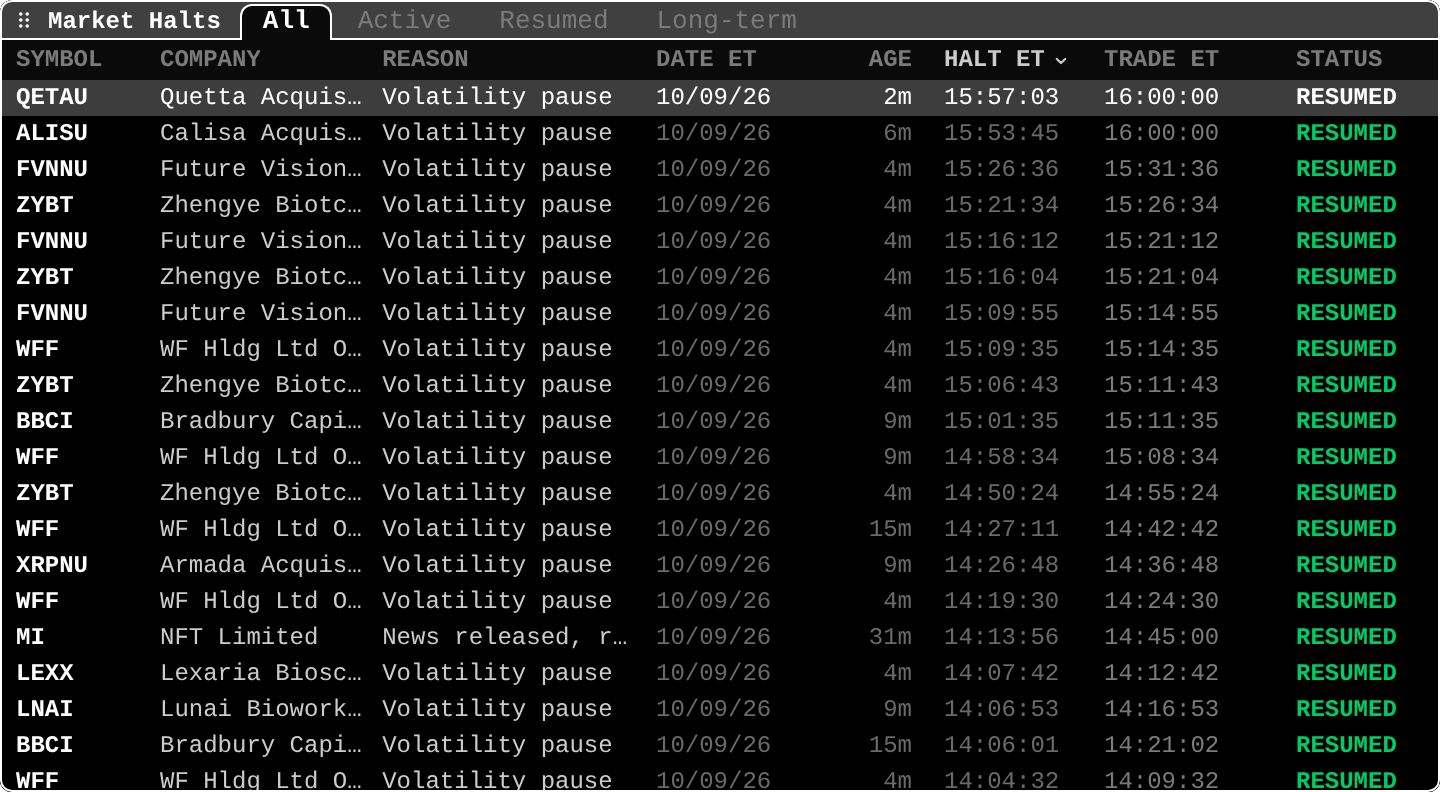
HALTMarket halts
Trading haltsCurrent and recent US trading halts with the reason code and resumption times.
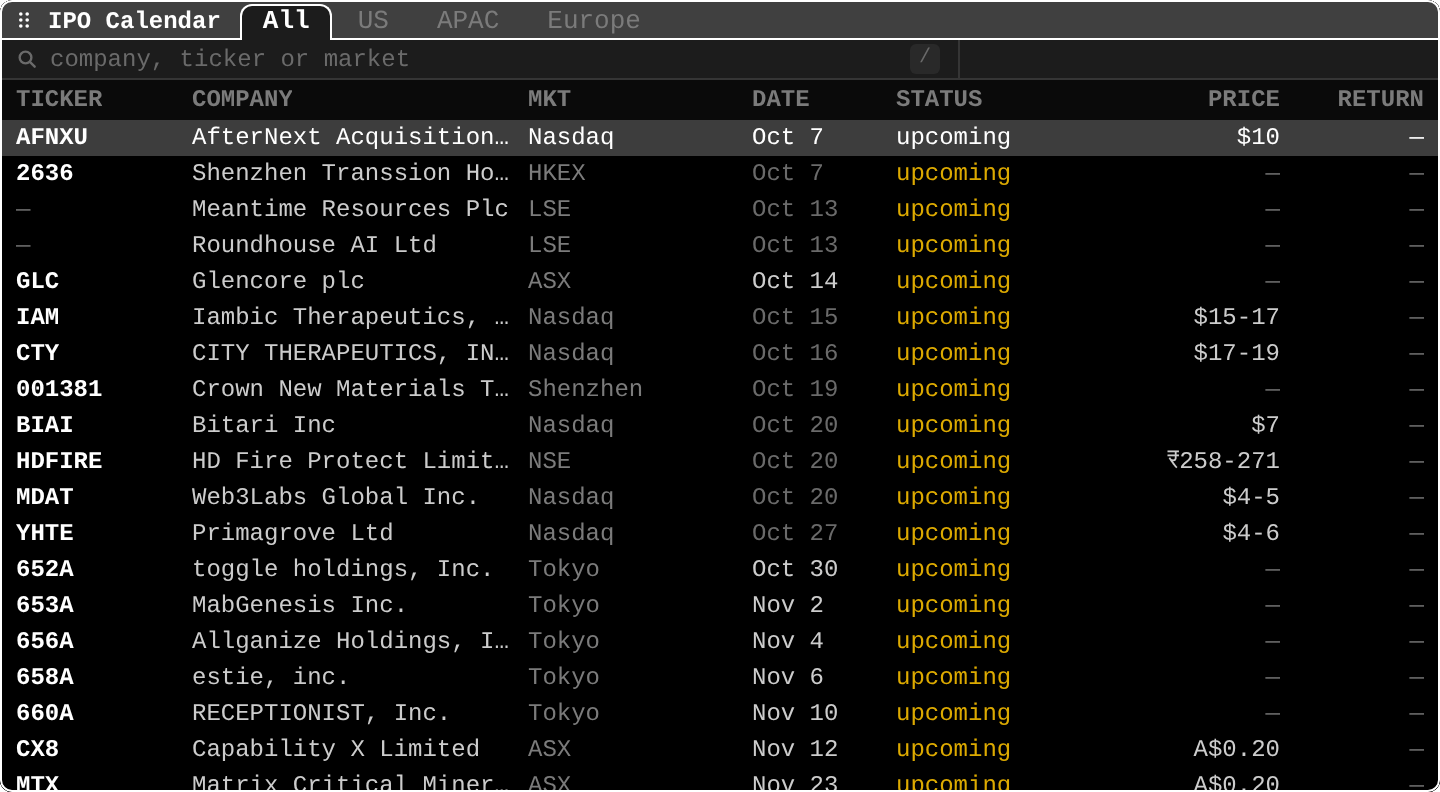
IPOIPO calendar
Upcoming and recent IPOs worldwideUpcoming and recently listed IPOs worldwide, with price in local currency, deal size in dollars, and first-day return.
- Example
IPO Klarna - Learn it in the Academy: IPOs (IPO)
- Example
THEMThematic baskets
Themes with equal-weight returnsCurated themes with equal-weight returns and breadth. Open a theme for its members, leaders and laggards. The Themes tab of BI.
- Example
THEM nuclear - Learn it in the Academy: Sectors, themes and rotation (BI, THEM, RRG)
- Example
MAM&A
Deals and arbitrage spreadsPending, rumored and closed mergers and acquisitions, with arbitrage spreads on listed targets. Free is delayed 7 days; Pro is live.
- Example
MA NVDA - Learn it in the Academy: Mergers and acquisitions (MA)
- Example
DISTDistress
Bankruptcy and delisting recordsDated public records about companies in difficulty: 8-K bankruptcy, obligation and listing filings, SEC going-concern disclosures, Taiwan exchange listing designations, and French and UK insolvency notices. The Distress tab of MA.
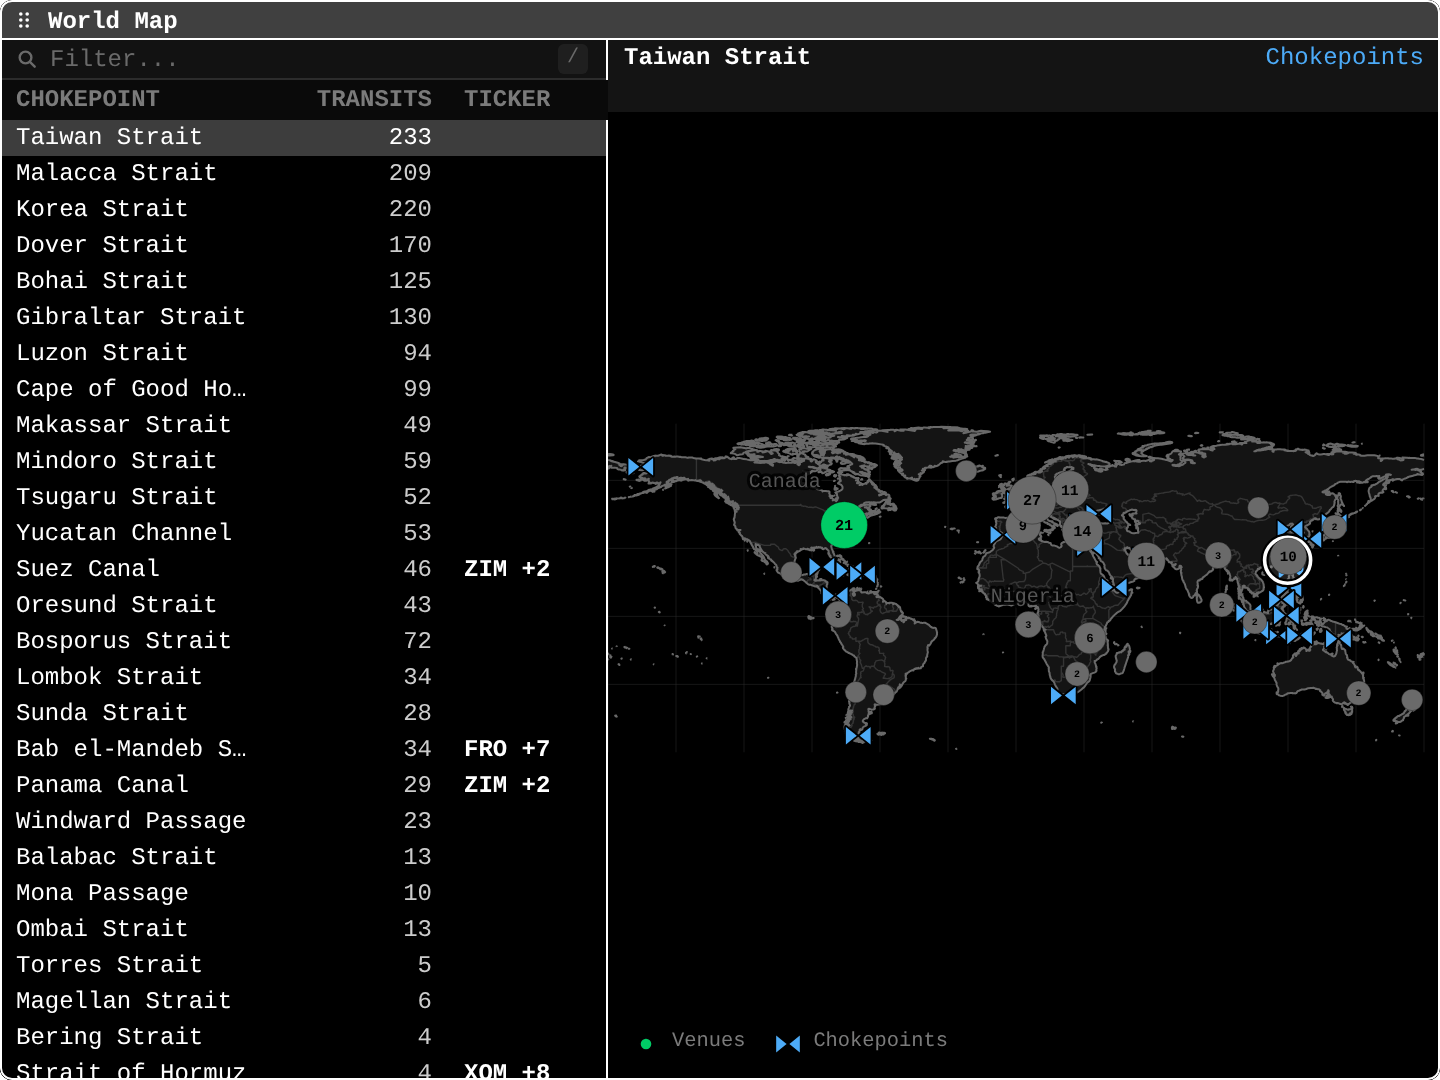
MAPWorld venue map
Exchange hours on a mapTrading venues around the world with open or closed status, local time, and time to the next session change.
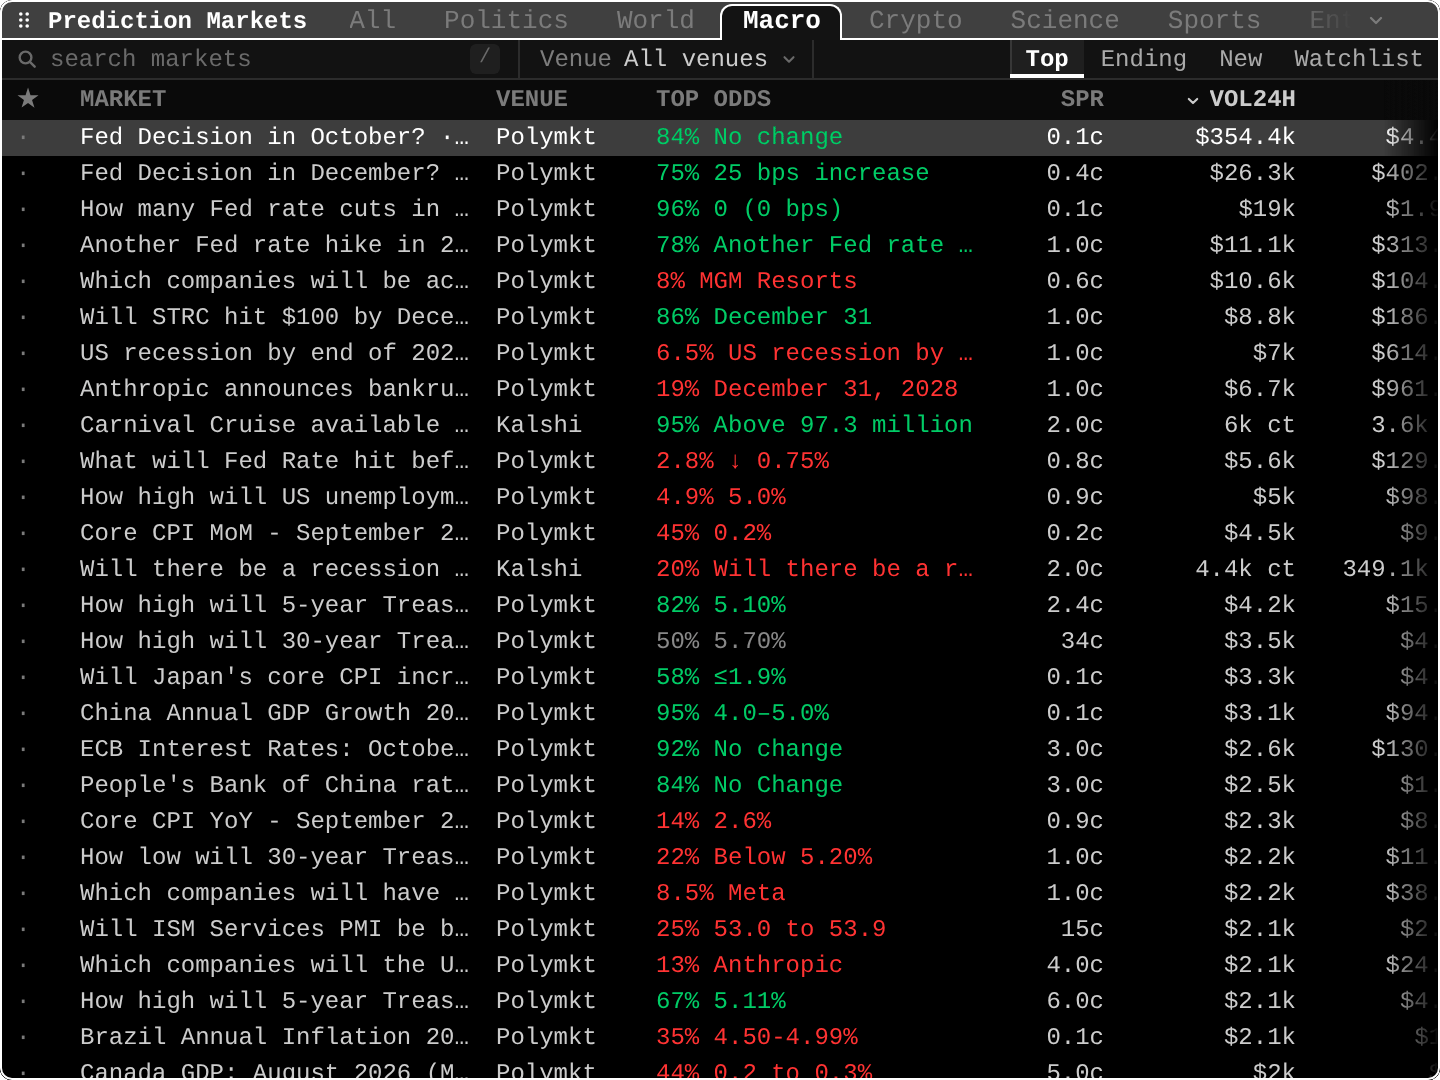
PMPrediction markets
Polymarket and Kalshi oddsPluginBrowse and search Polymarket and Kalshi markets by category with top odds, spread, and volume, and chart any market's history.
- Example
PM inflation - Plugin: Prediction Markets
- Learn it in the Academy: Prediction markets (PM)
- Example
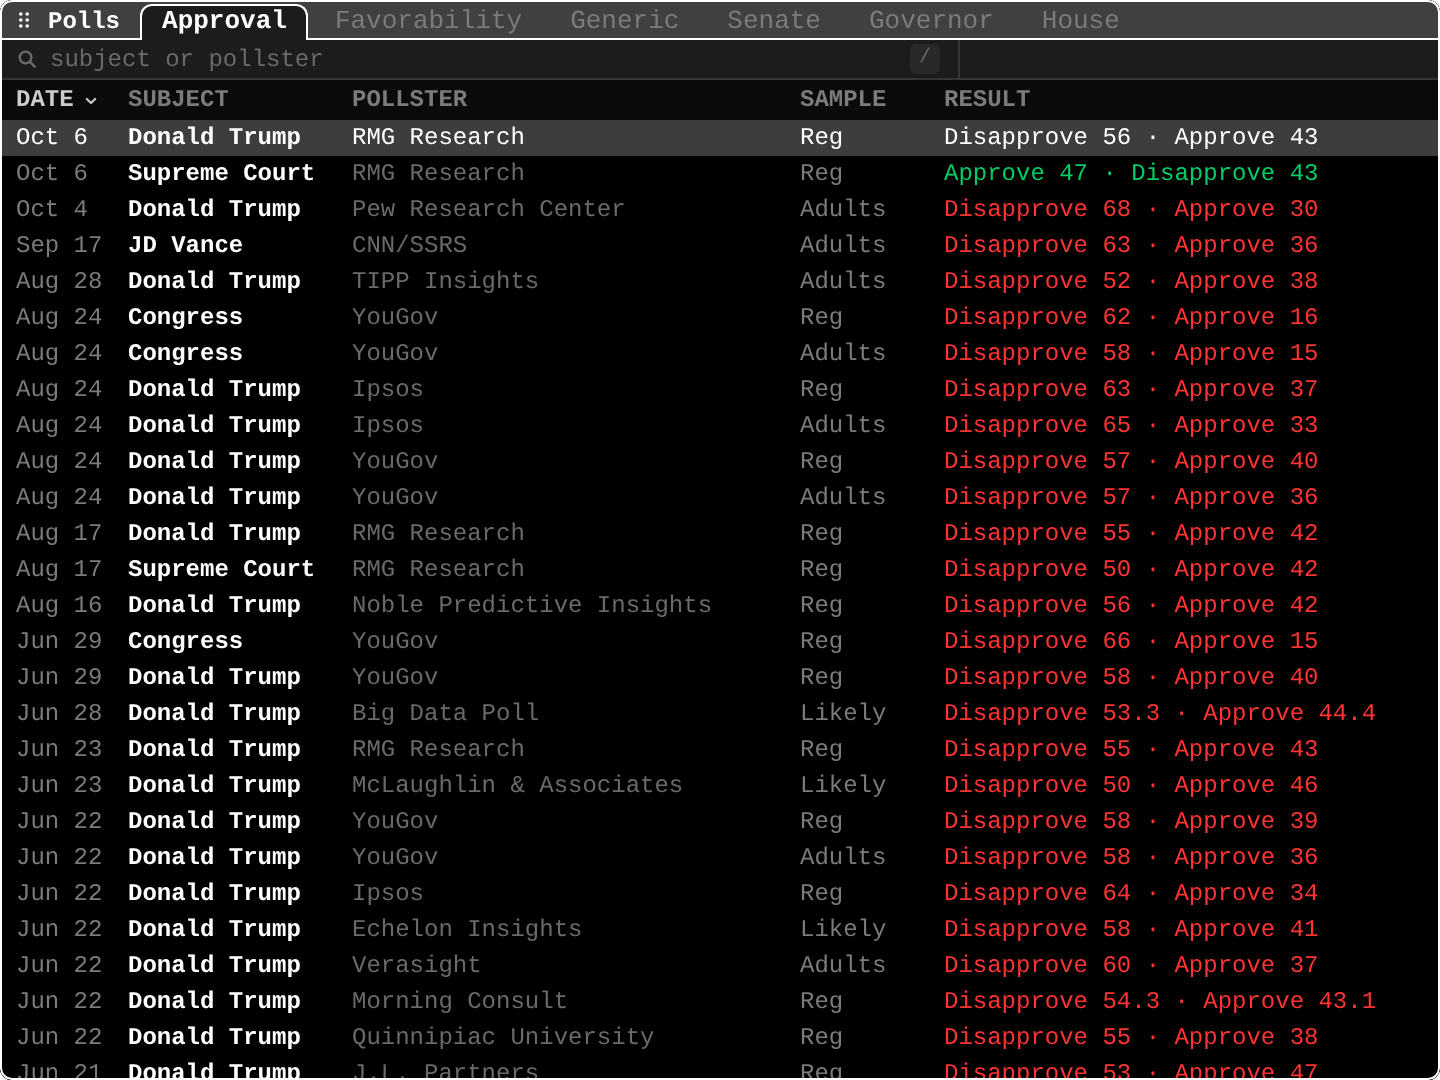
POLLPolls
Political pollingPluginVoteHub polls by type (approval, favorability, generic ballot, Senate, governor, House) with trend charts and pollster breakdowns.
CHOKEChokepoint transits
Ships through Suez, Hormuz, PanamaDaily vessel transits through the main shipping chokepoints, charted together or one by name. Use it to see a disruption in trade before it shows up in prices; each transit series also charts in G next to oil or a shipper.
- Example
CHOKE SUEZ
- Example
Macro and rates
19Calendars, FRED series and central bank data.
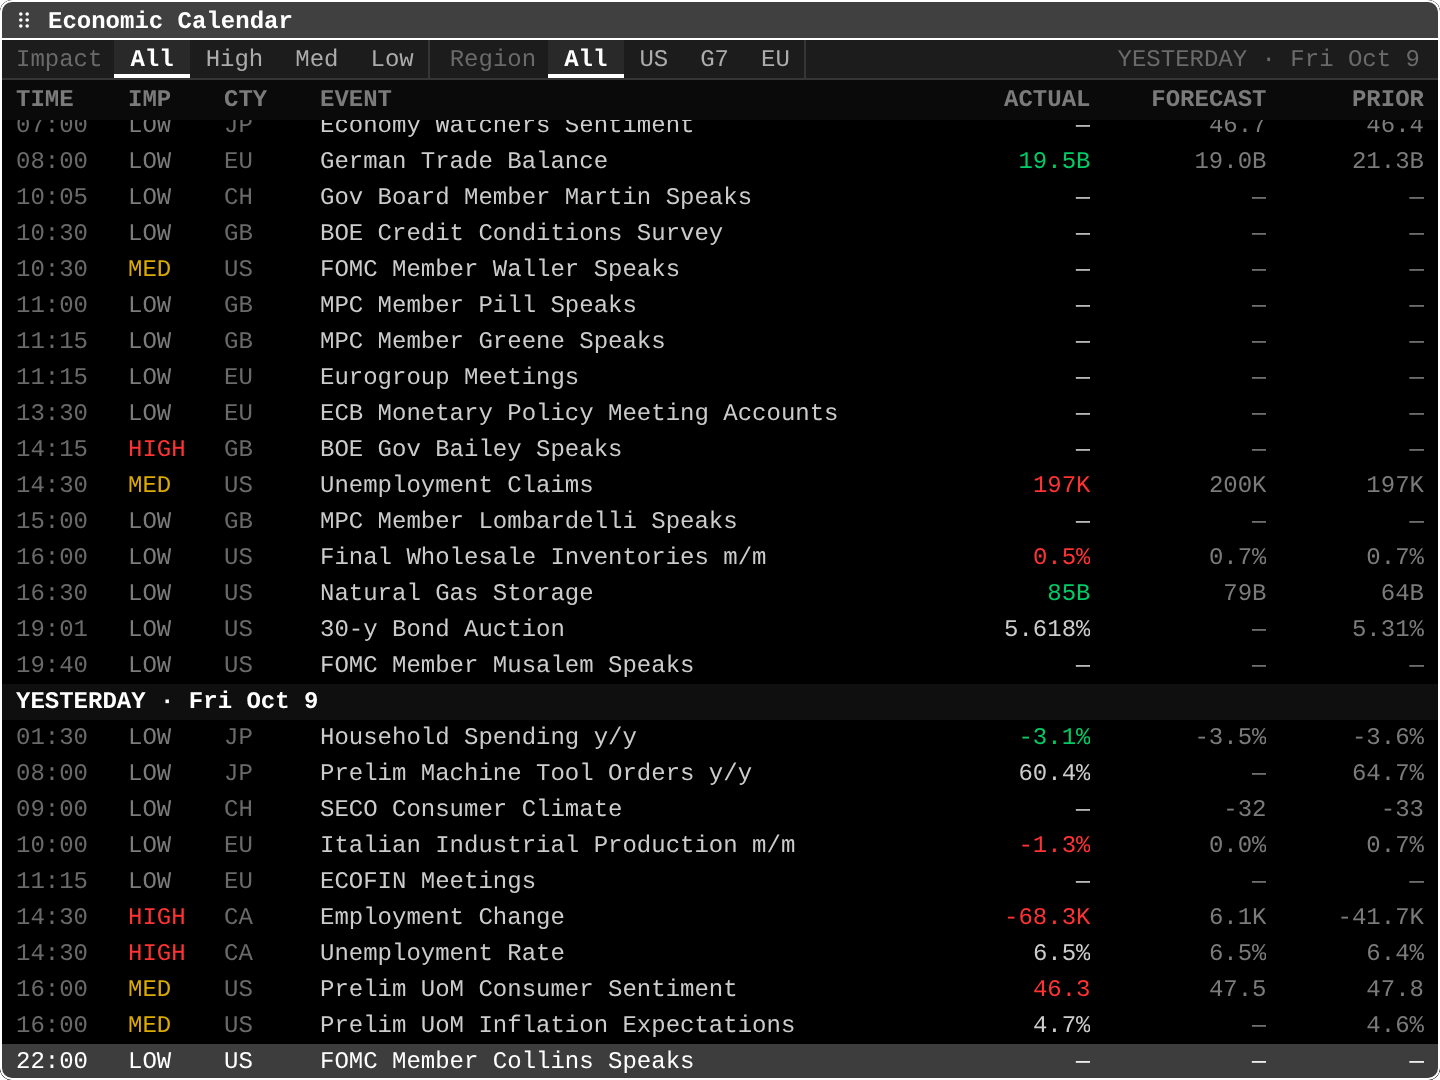
ECOEconomic calendar
Releases and eventsUpcoming releases and central bank events with impact, country, actual, forecast, and prior.
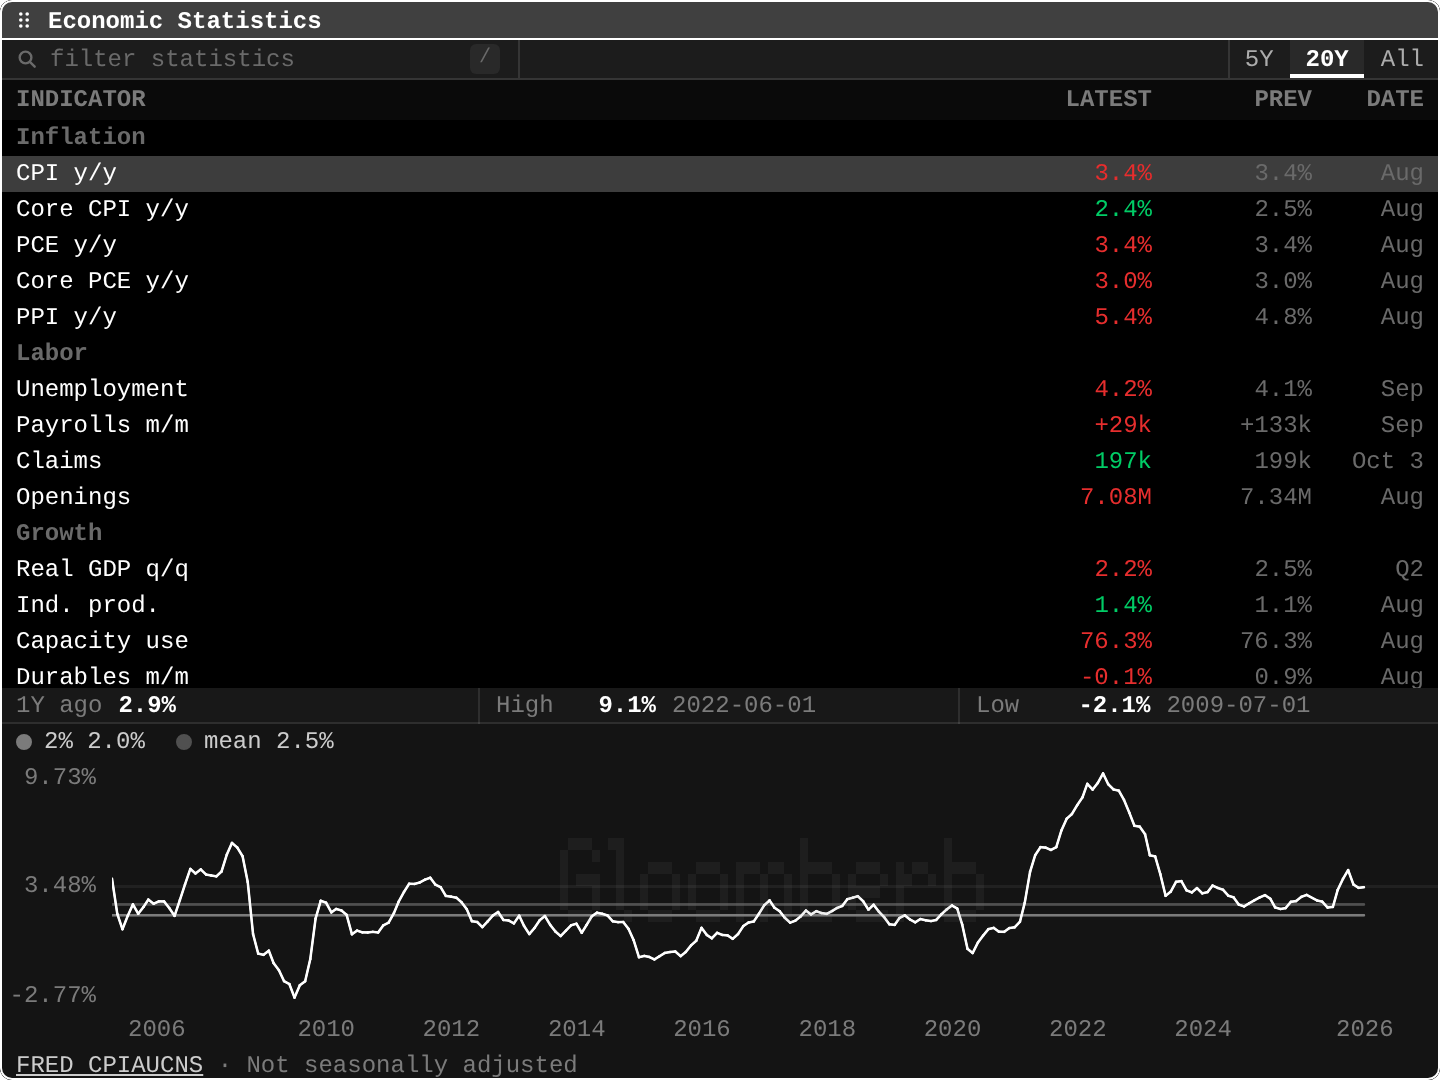
ECSTEconomic statistics
Indicators vs their historyInflation, labour, growth, housing, and rates indicators with the latest print, the prior, and a chart against their own history.
- Example
ECST cpi-yoy - Learn it in the Academy: Economic statistics (ECST)
- Example
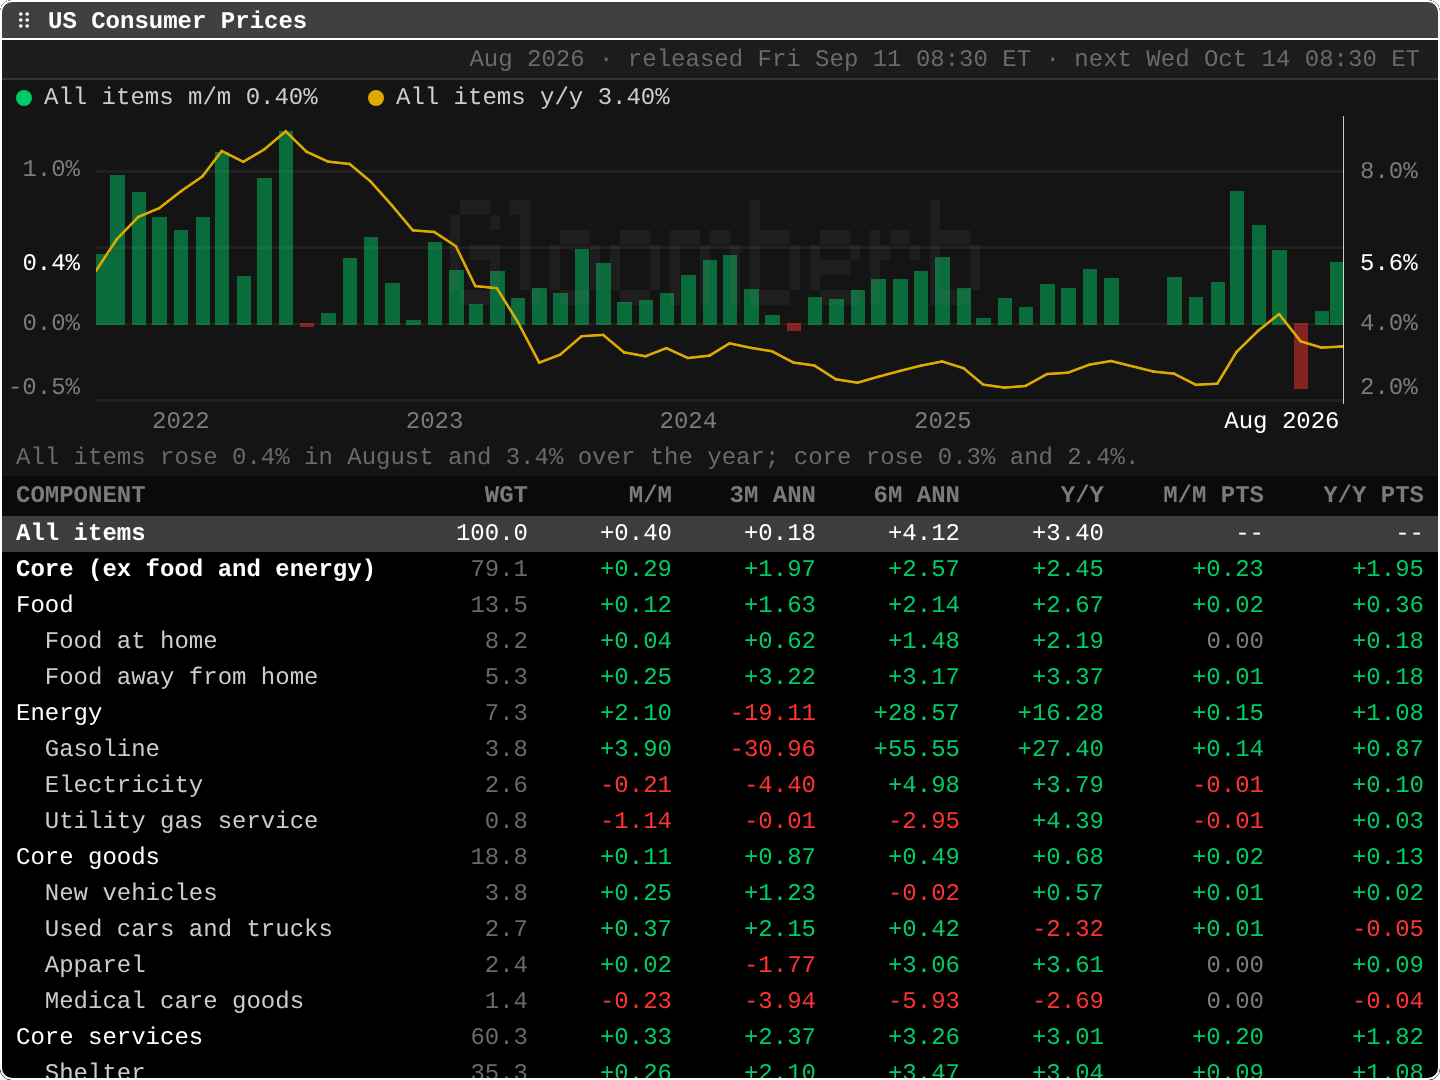
CPIUS consumer prices
CPI by componentUS inflation by component (food, energy, core goods, shelter, services ex shelter) with each one's weight, monthly and yearly change, and points added to the headline. The header gives the next release. ECAN opens it too.
- Example
CPI shelter - Learn it in the Academy: Inflation by component (CPI)
- Example
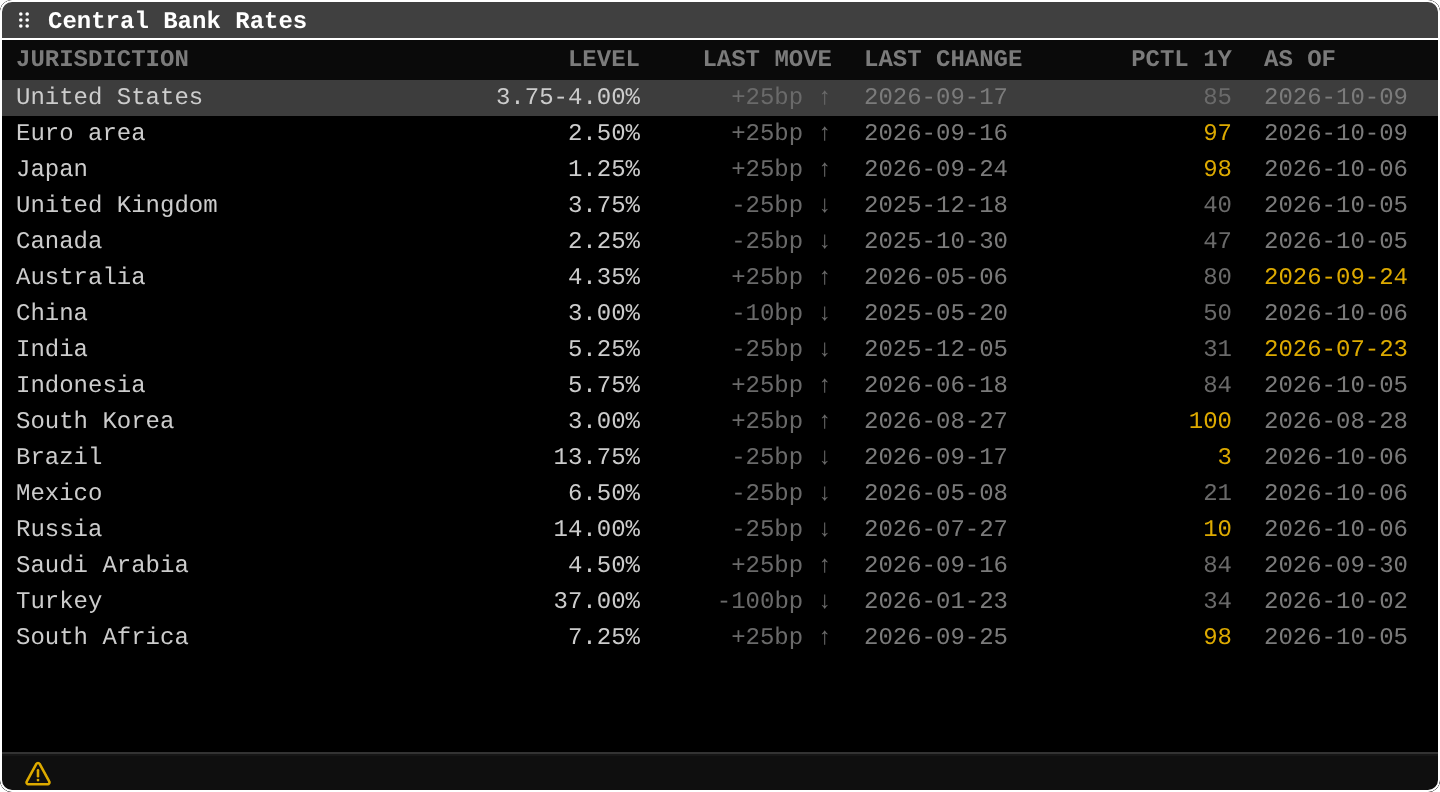
CBRCentral bank rates
Central bank policy ratesPolicy rates for the G20 central banks, the SNB, Norges Bank, the Riksbank and the RBNZ with the last move, its date, and a one-year percentile; open one for its history. ECFC and CBRT open it too.
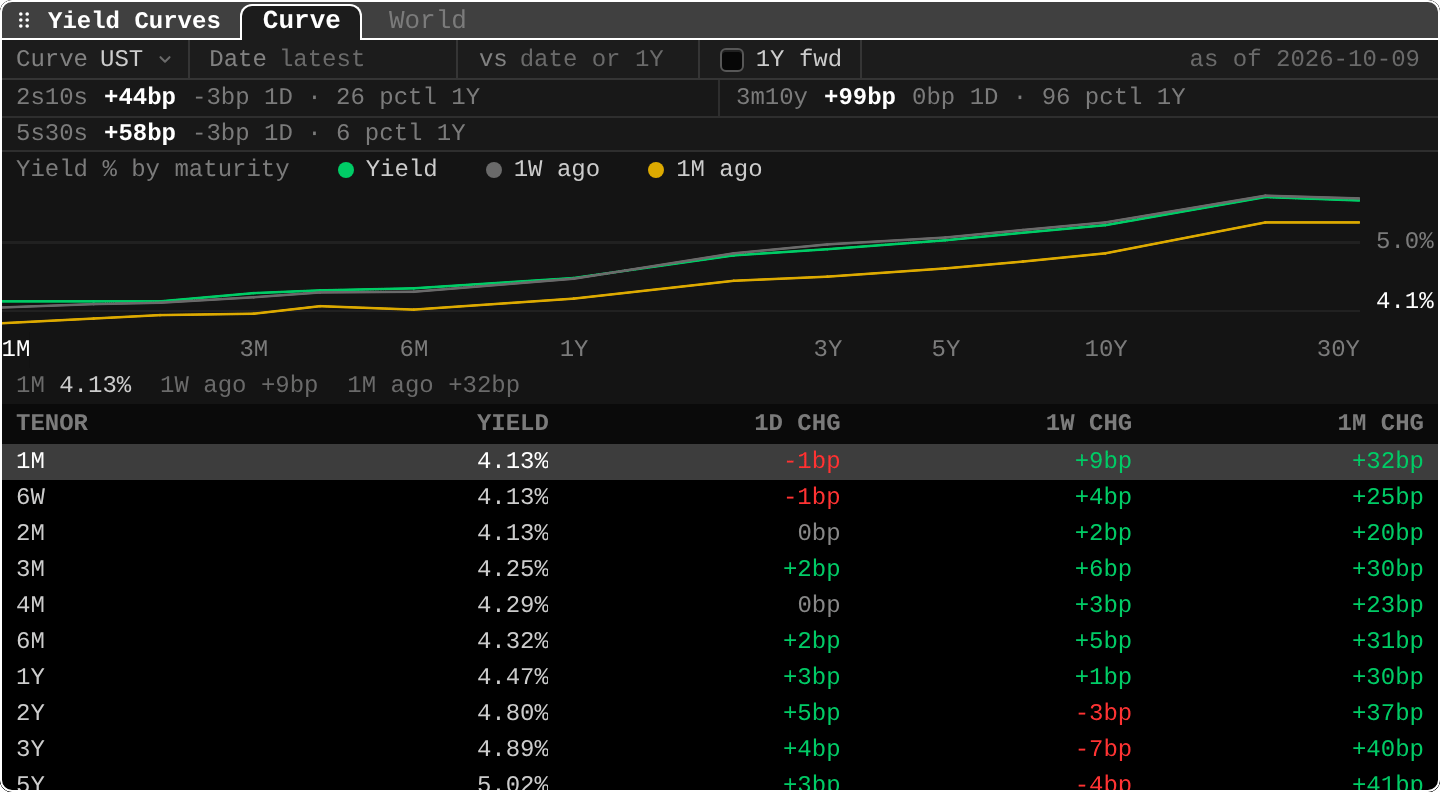
GCYield curves
Government bond curvesGovernment yield curves: US Treasury, TIPS real yields and breakevens, euro AAA, Bund, Gilt, JGB and Canada, with spreads like 2s10s and their one-year percentiles, a two-date difference and a World tab. GC JGB opens a curve directly.
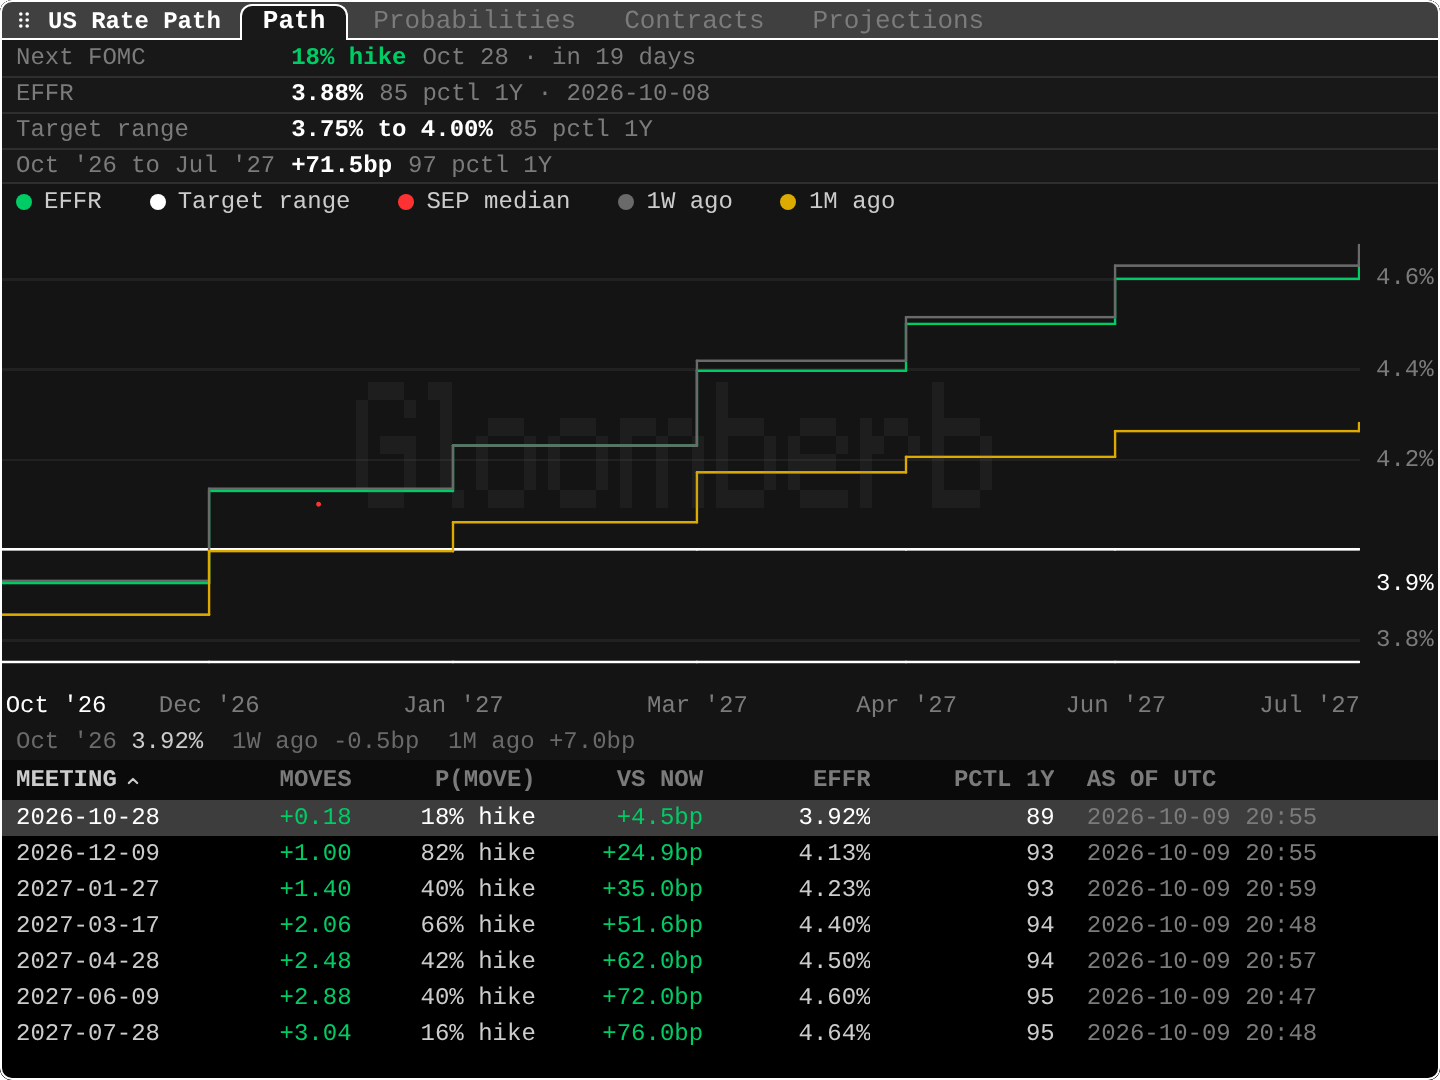
WIRPUS rate path
Fed path from futuresThe fed funds rate priced for each upcoming FOMC meeting from futures, against a week and a month ago and the Fed's projections, with per-meeting probabilities. FFIP opens it too.
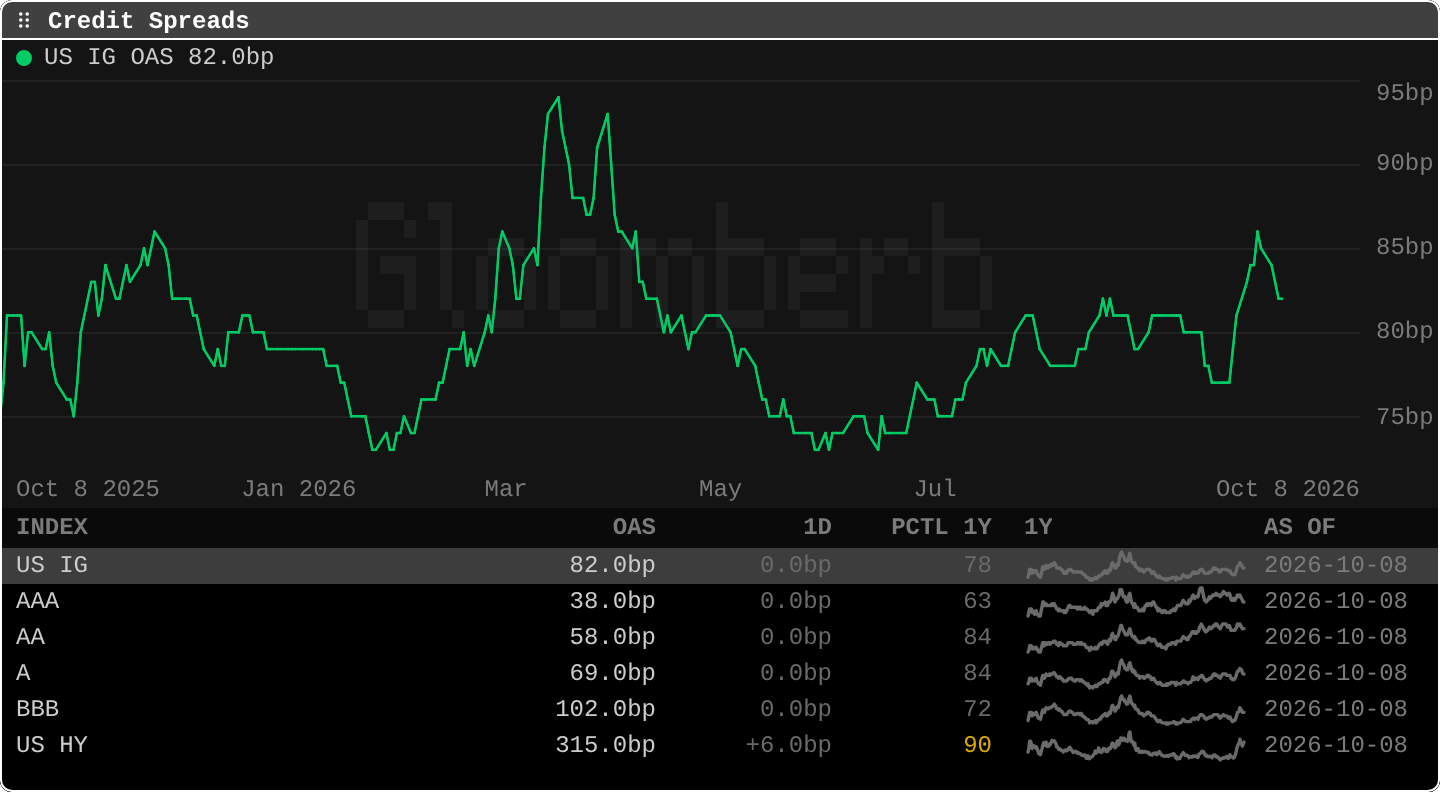
CRDCredit spreads
Corporate OASICE BofA US corporate option-adjusted spreads by rating bucket and high yield, with the day's change.
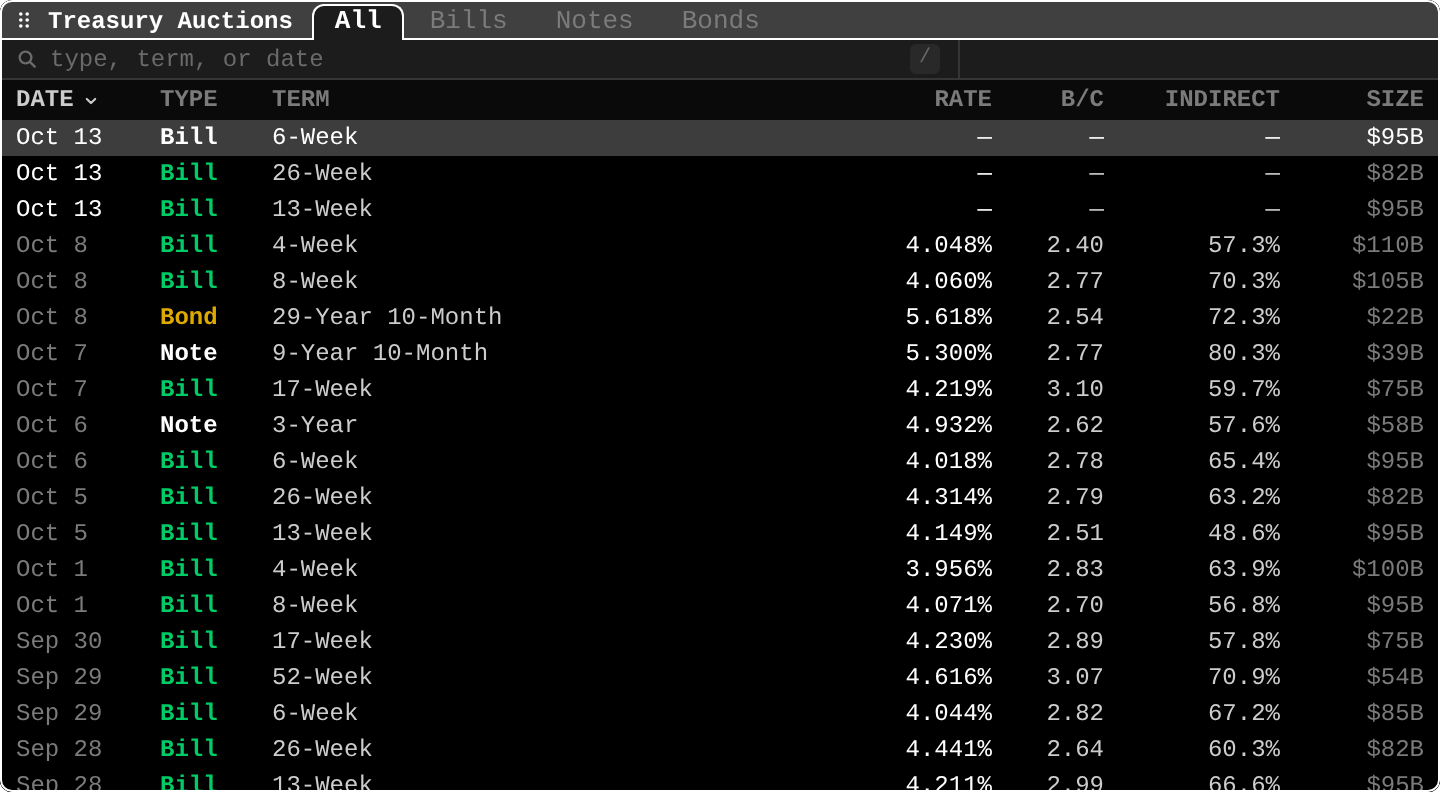
AUCTTreasury auctions
Auction resultsBill, note, bond, and TIPS auction results from the US Treasury: high rate, bid-to-cover, indirect share, and size.
- Example
AUCT 10-year - Learn it in the Academy: Treasury auctions (AUCT)
- Example
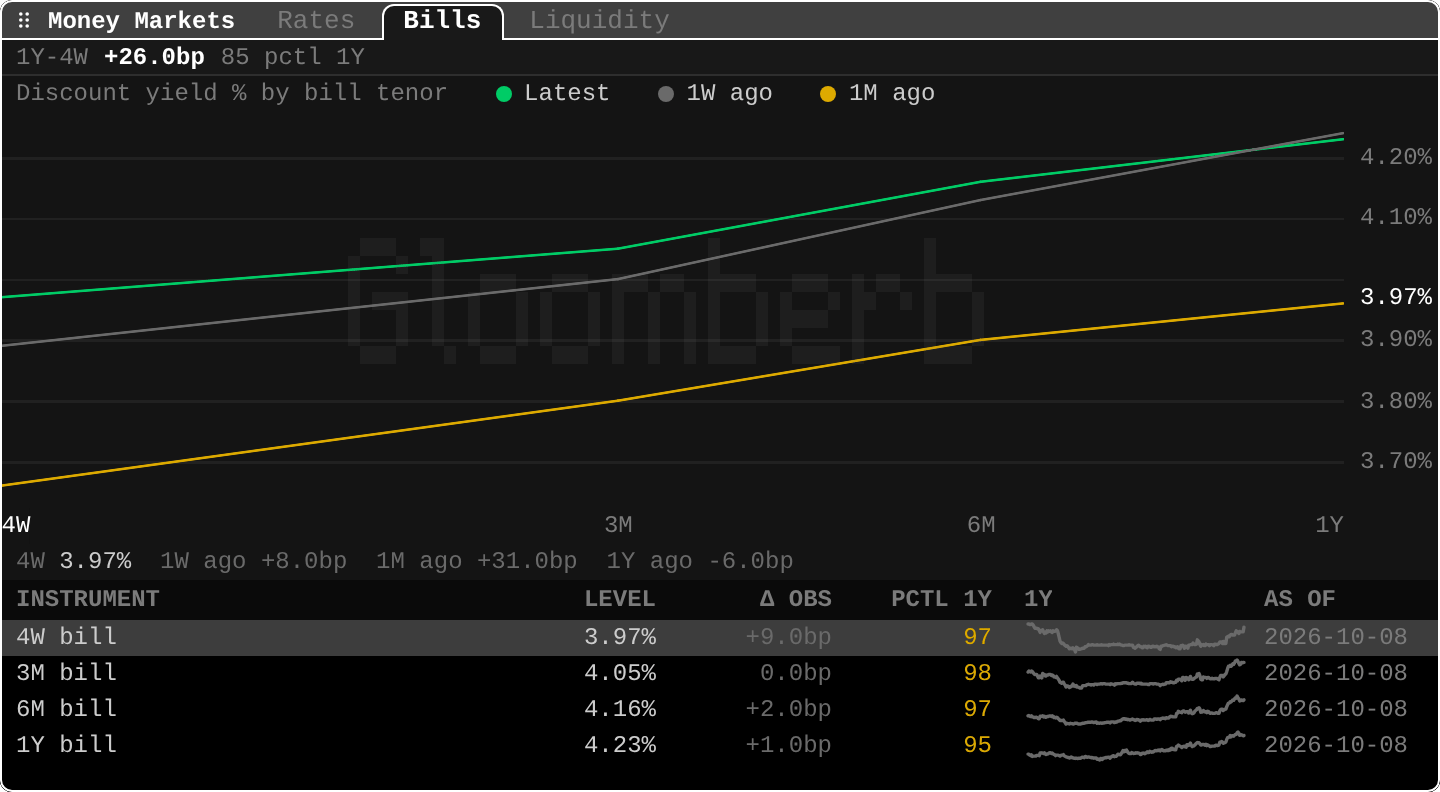
BTMMMoney markets
Funding rates, bills, liquidityFunding rates (SOFR, EFFR, IORB), Treasury bill yields and their curve, and Fed liquidity from reserves to the reverse repo, each with its one-year percentile and history.
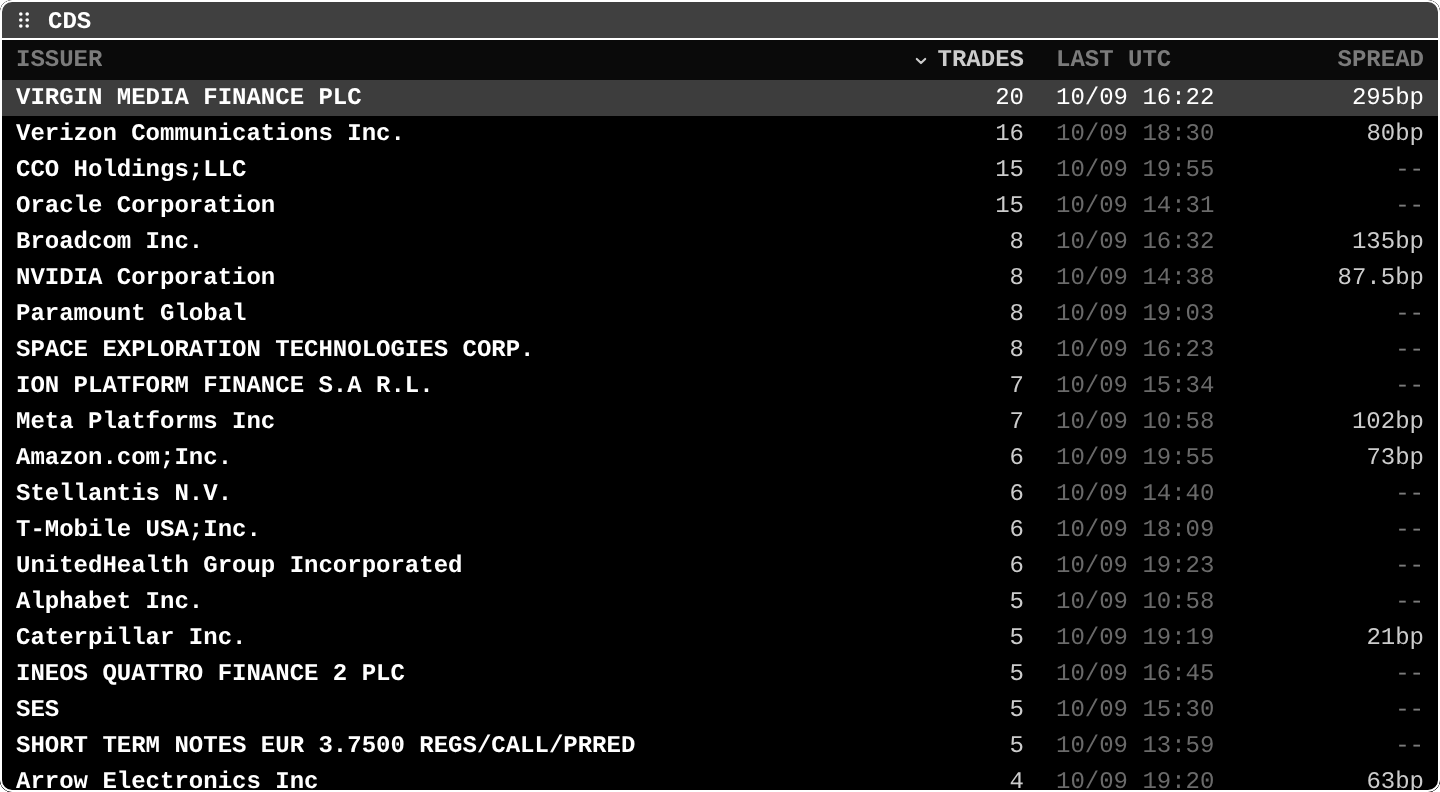
CDSSingle-name CDS
Corporate 5Y CDS and tradesSingle-name corporate CDS. CDS alone lists the issuers traded in the last 5 days with trade count, last trade, 5Y spread and its 1W and 1M moves through the roll while the level is current (points upfront past 2,000 bp), ranked with --sort spread, 1w or 1m; with a ticker or issuer, its 5Y spread (level, date, 1W and 1M change, range), its trades and its daily 5Y levels (--csv --section daily exports them).
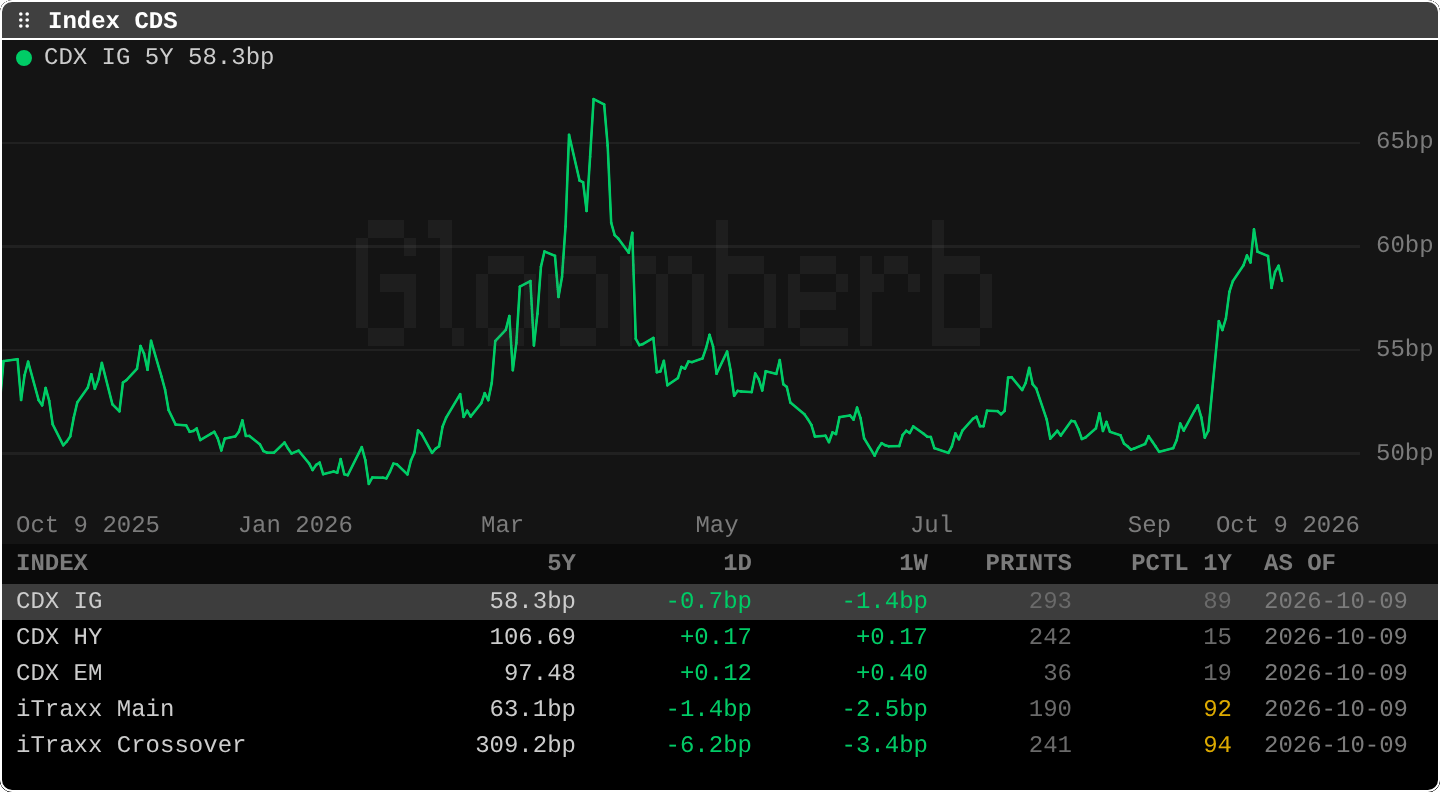
CDXIndex CDS
CDX and iTraxx on the runCDX IG, HY and EM with iTraxx Main and Crossover on the run: the 5Y level, 1D and 1W moves, 1Y percentile and the day's print count. IG and iTraxx in spread, HY and EM in price.
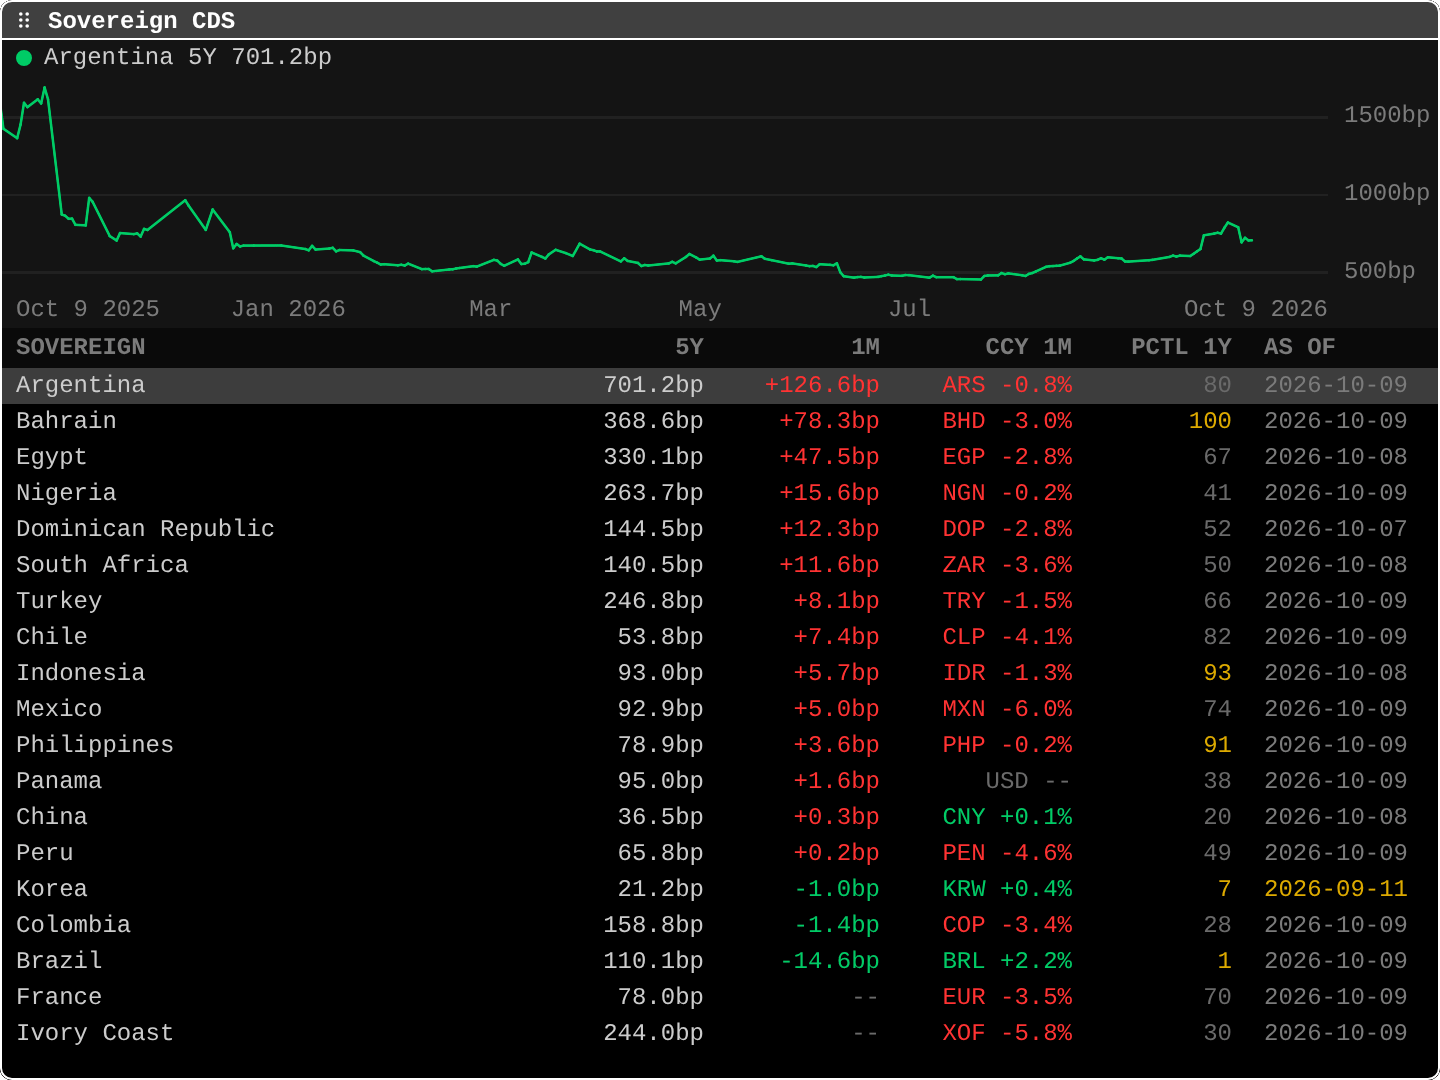
SOVRSovereign CDS
Country 5Y CDSSovereign 5Y CDS ranked by the month's move, beside the local currency's move against the dollar, with each country's year of history. WCDS opens it too.
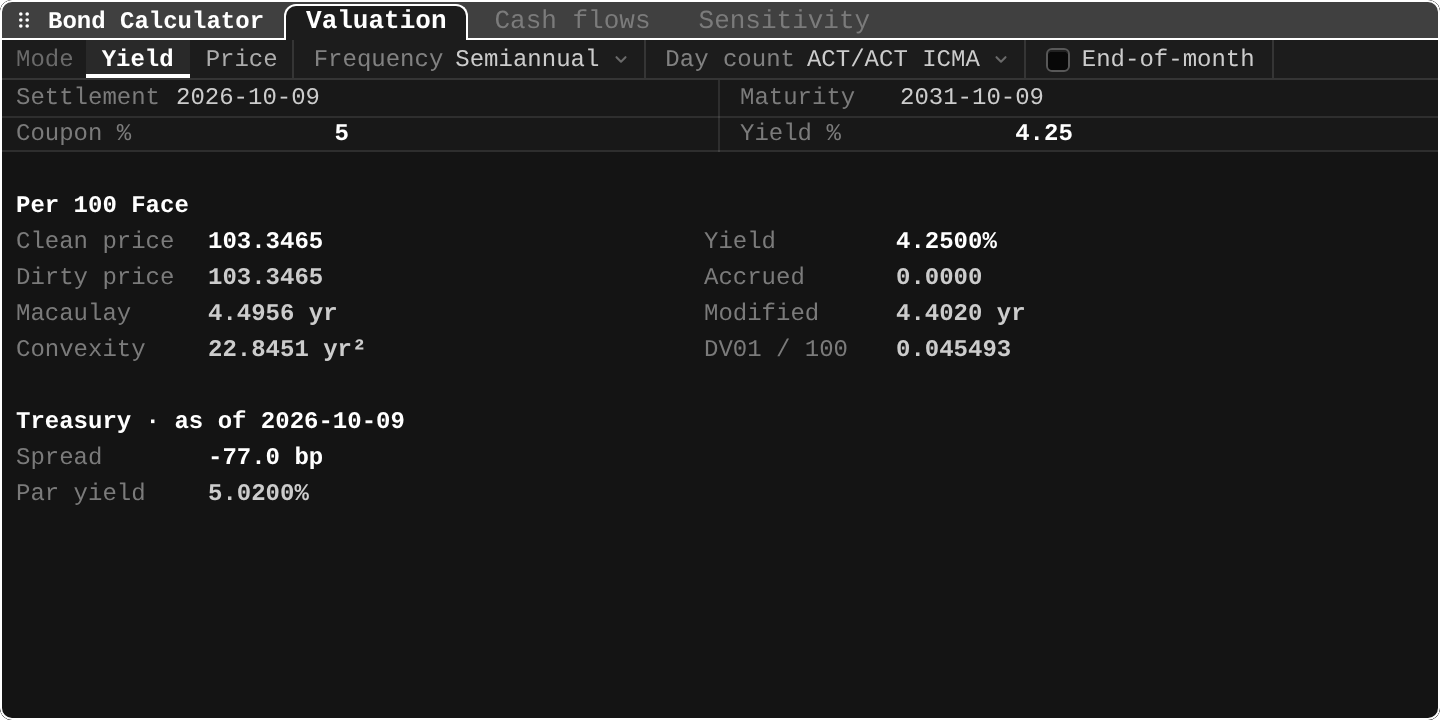
YASBond calculator
Price, yield, durationPrice a fixed-coupon bond from a yield, or solve the yield from a price: accrued interest, duration, convexity, DV01, spread to Treasuries, cash flows, and price at yield shifts.
FIFixed Income
Credit, bonds, and TreasuriesOne workspace for credit markets, issuer debt, corporate bond sales, Treasury auctions, Treasury cash and debt, and primary dealer positions. FI opens it; the older shortcuts still land on their own section.
TRACECorporate bond tape
Corporate and agency sales by issuer or CUSIPLatest corporate and agency bond sales: issuer, CUSIP, coupon, maturity, price, yield, and grade. TRACE alone lists the tape; TRACE with an issuer name, a bond symbol root, a stock ticker, or a CUSIP finds that issuer's outstanding bonds. It opens the Bonds section of Fixed Income.
- Example
TRACE issuer
- Example
DTSTreasury cash and debt
Operating cash and debt held by the publicTreasury operating cash for the latest day, and debt held by the public for the last 20 business days. It opens the Treasury section of Fixed Income.
PDLRPrimary dealer positions
Weekly dealer positions and failsWeekly net positions and settlement fails in Treasuries and mortgage-backed securities, from the primary dealers. It opens the Treasury section of Fixed Income.
VALMarket valuation
Whole-market multiplesMarket-wide valuation ratios against their own history, with zones and trend deviation.
- Example
VAL buffett - Learn it in the Academy: Sentiment and market valuation (FNG, VAL)
- Example
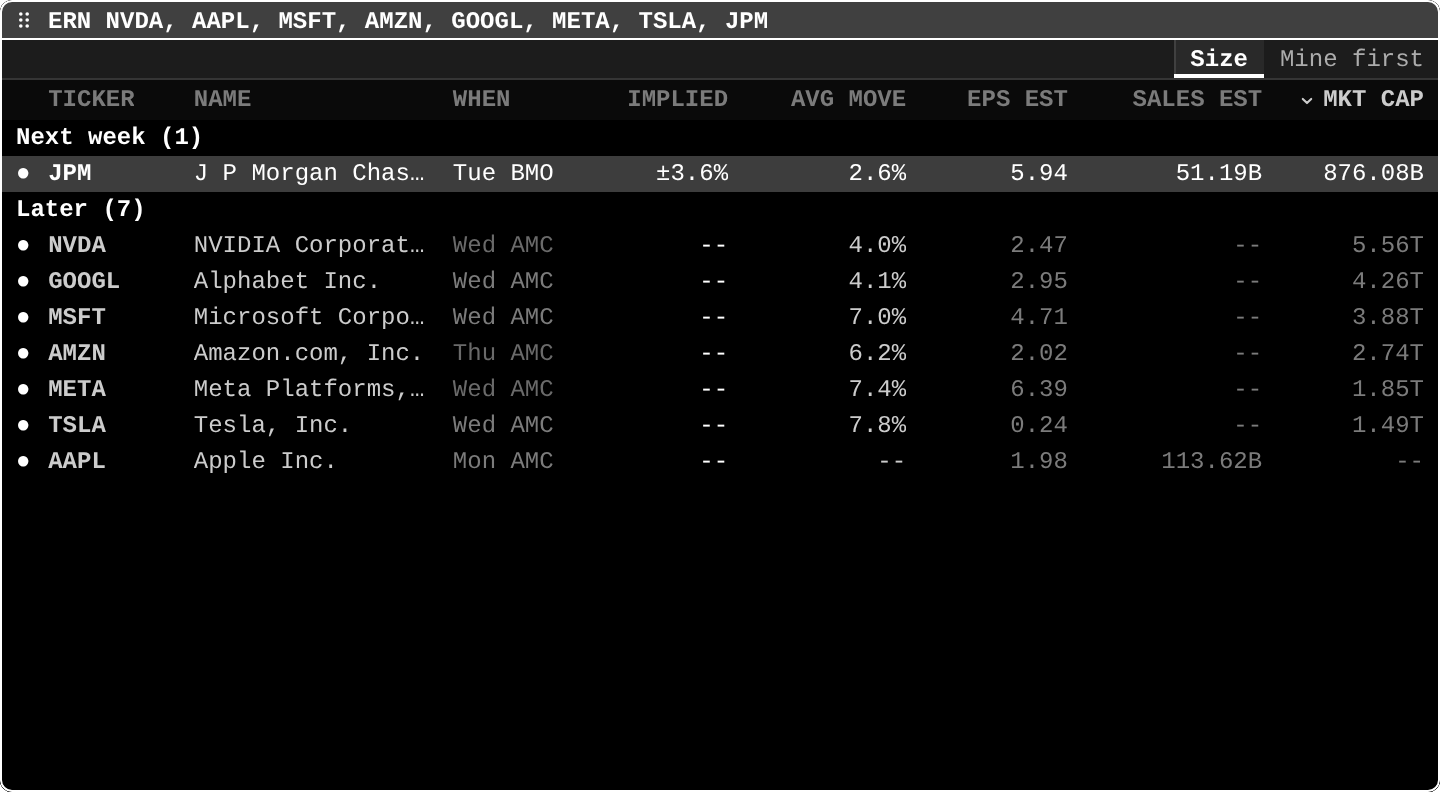
ERNEarnings calendar
Upcoming earnings datesUpcoming earnings dates and estimates grouped by when they report, with implied and past moves. Alone it follows your portfolio and watchlists; with tickers, just those. EVTS opens it too.
- Example
ERN NVDA, AAPL, MSFT - Learn it in the Academy: The earnings calendar and implied moves (ERN, EVTS)
- Example
Ownership and filings
7Who owns what and what they filed.
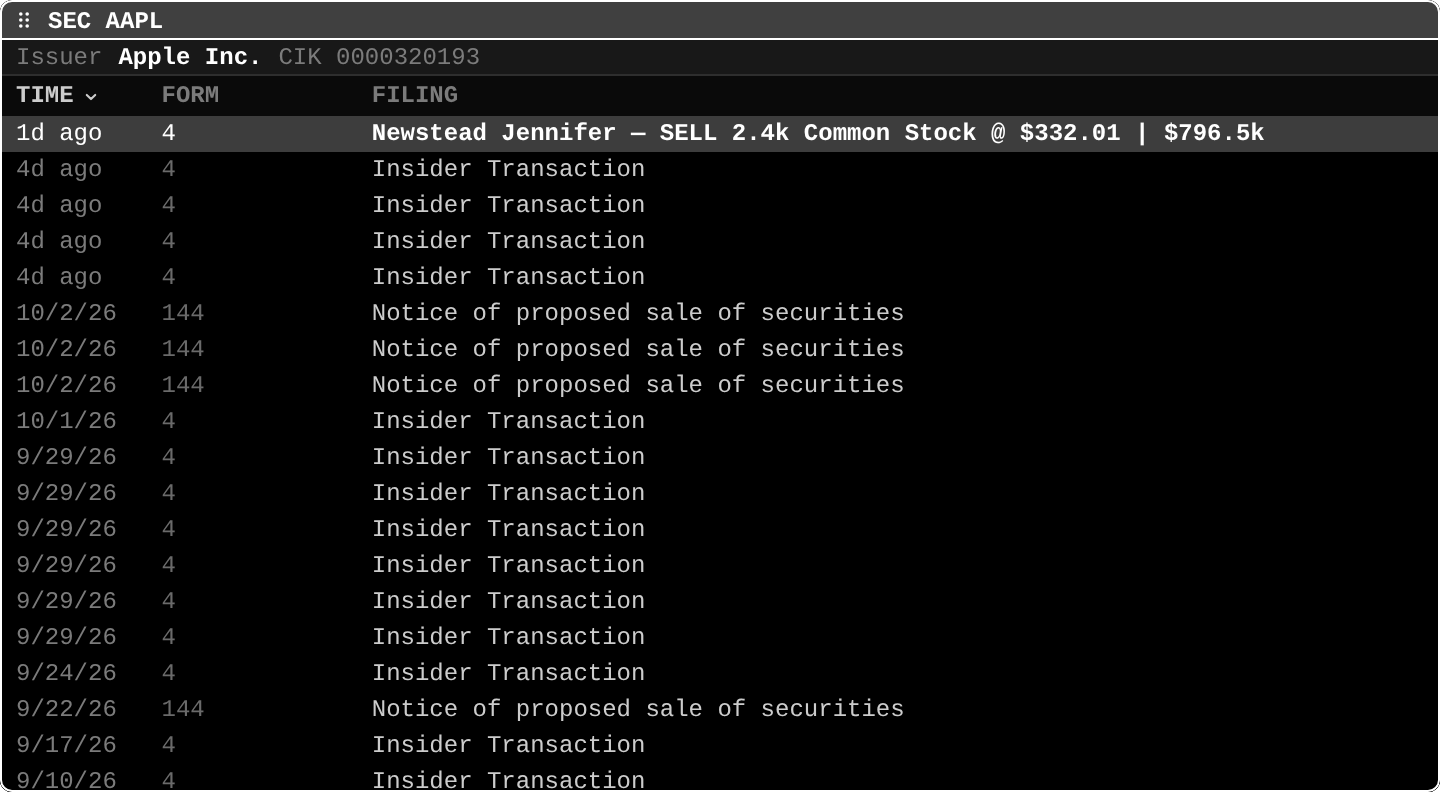
SECSEC filings
Recent filingsRecent SEC filings for a ticker with form type and date; open any of them inline. US equities only.
- Example
SEC AAPL - Learn it in the Academy: SEC filings and 8-K events (SEC, EK)
- Example
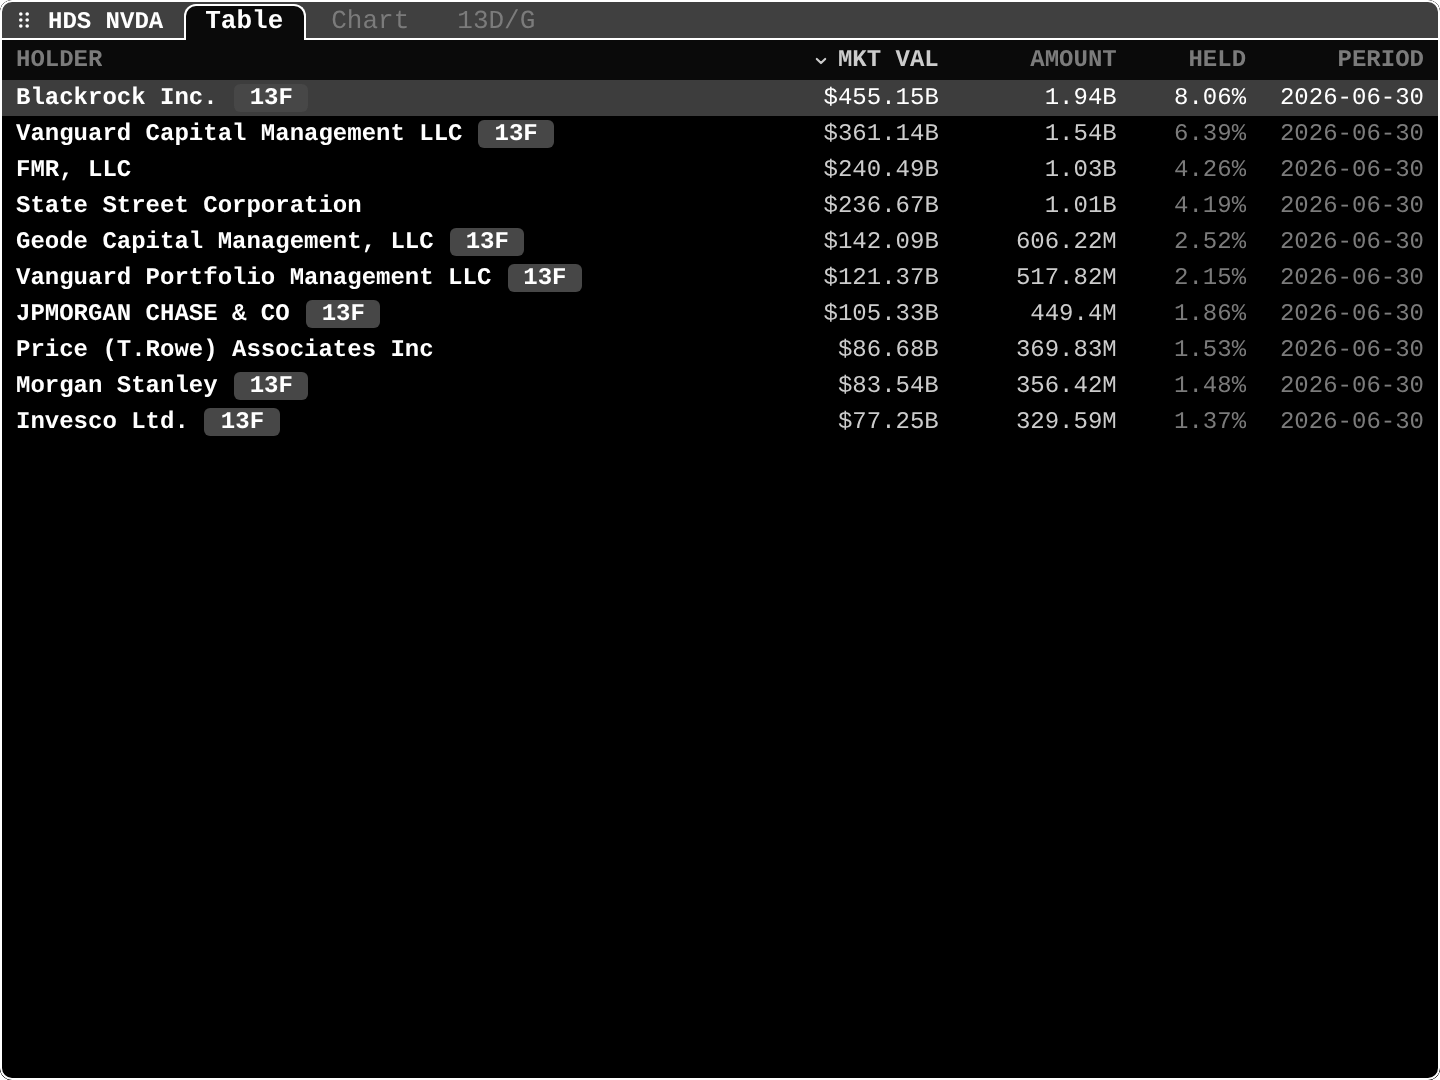
HDSHolders
Institutional holdersInstitutional holders as a table (value, shares, change, percent held) or as an ownership treemap.
- Example
HDS NVDA - Learn it in the Academy: Big holders and 13F filings (HDS, 13F)
- Example
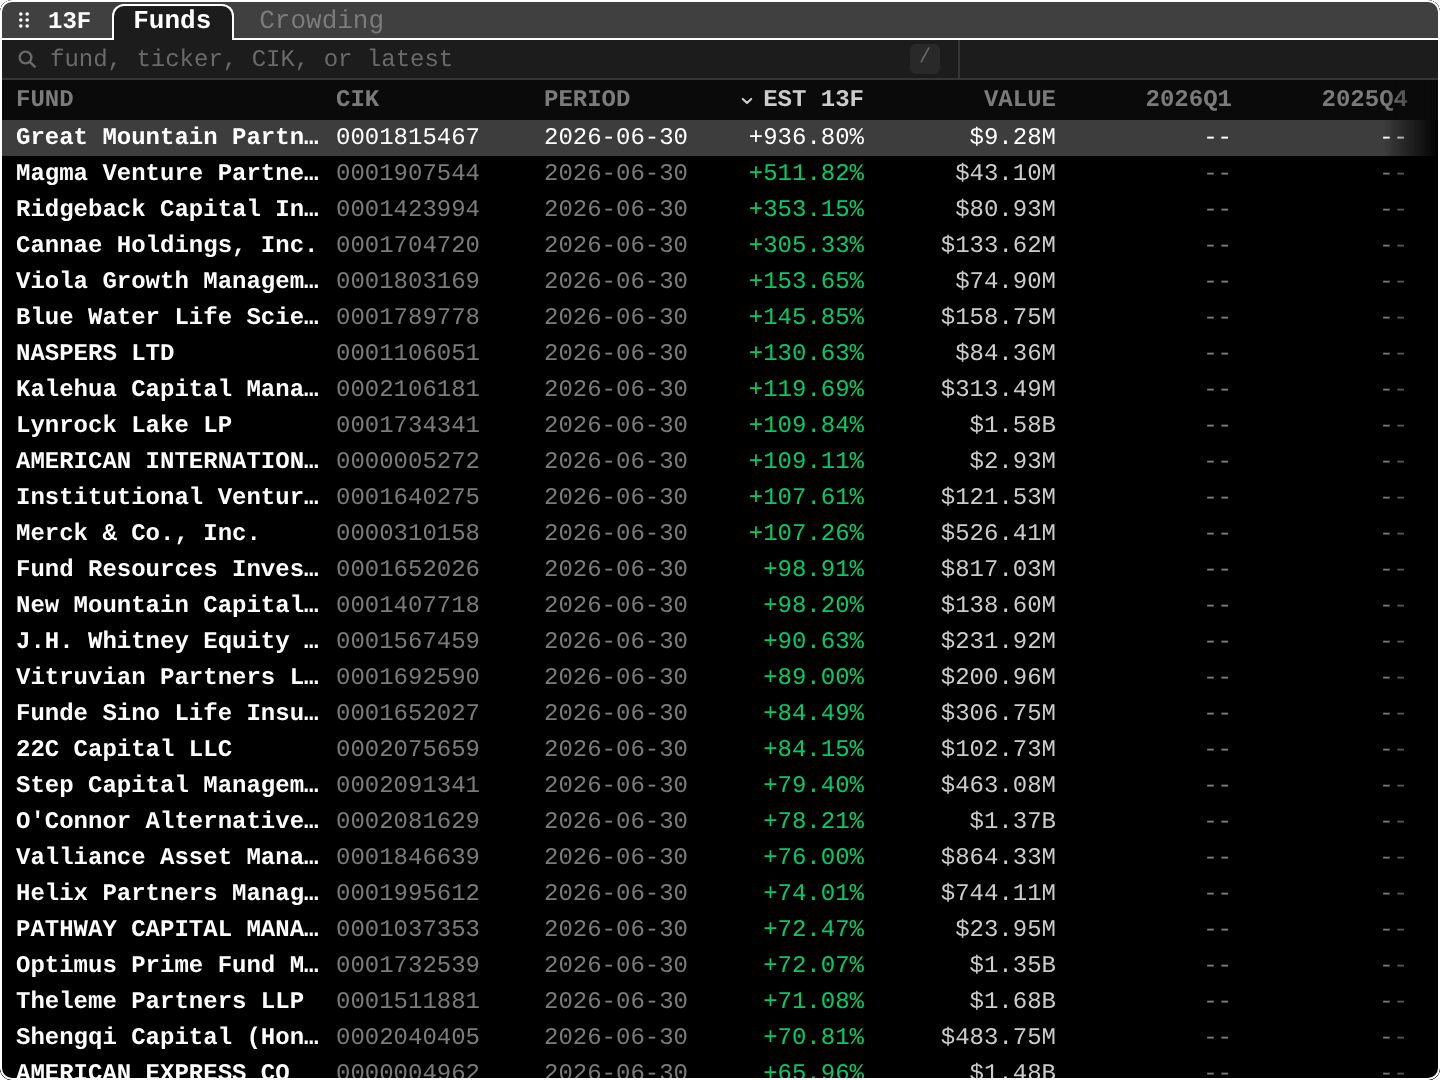
13F13F funds
Fund filings and holdingsBrowse institutional 13F filings by fund, ticker, or CIK with estimated long-book performance, holdings, and filing history. Option values are underlying notional, not market value.
- Example
13F fund or ticker
- Example
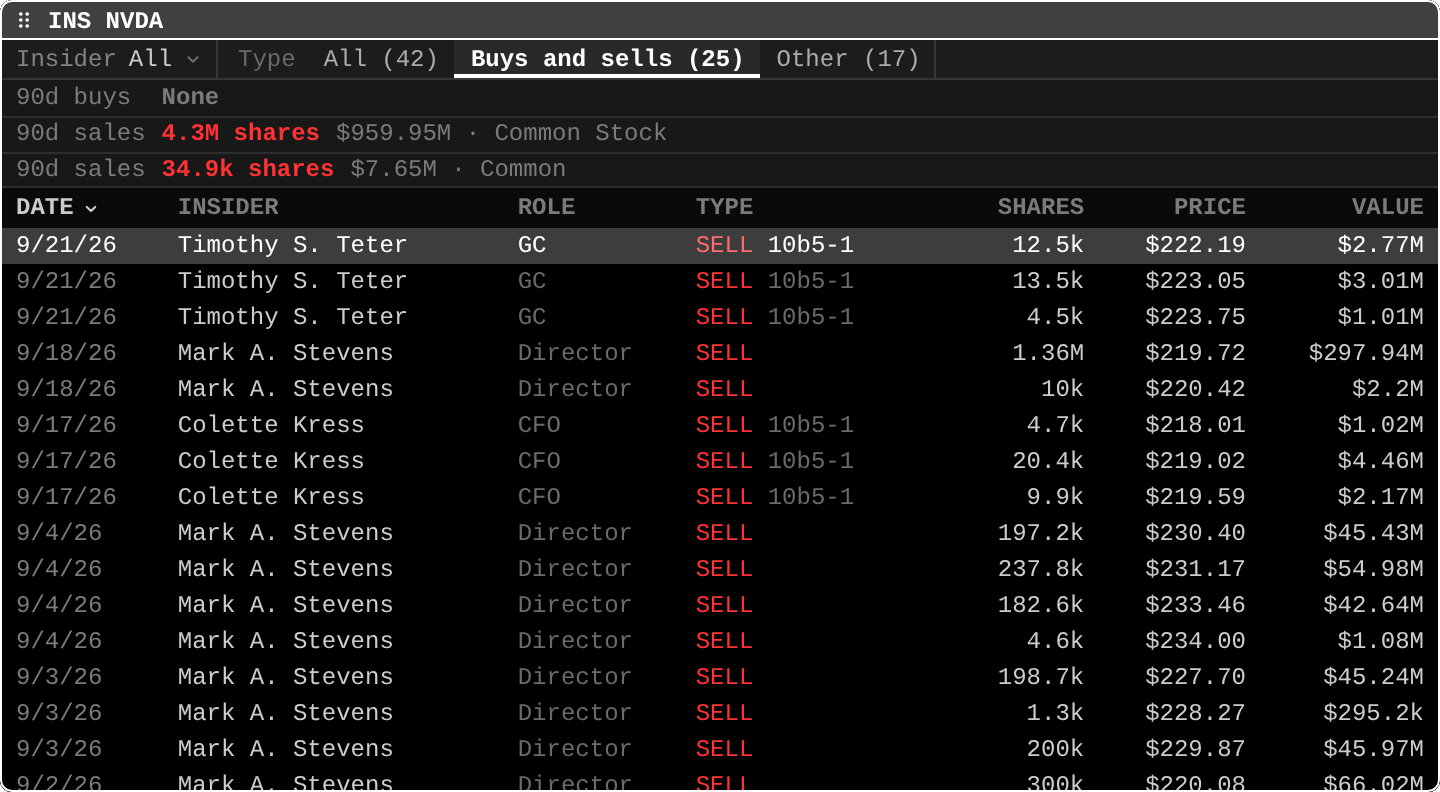
INSInsider transactions
Form 4 activity, insider buying and sellingInsider buys, sells, awards, and gifts from Form 4 filings with insider name, size, and price. Alone it ranks the companies whose insiders are buying, or selling, in the market, with why: clusters, repeat trades, size against their usual, the stake added or sold. Filters by role, size, cluster, new or exited positions and market cap. US equities only.
- Example
INS NVDA - Learn it in the Academy: Insider trades (INS)
- Example
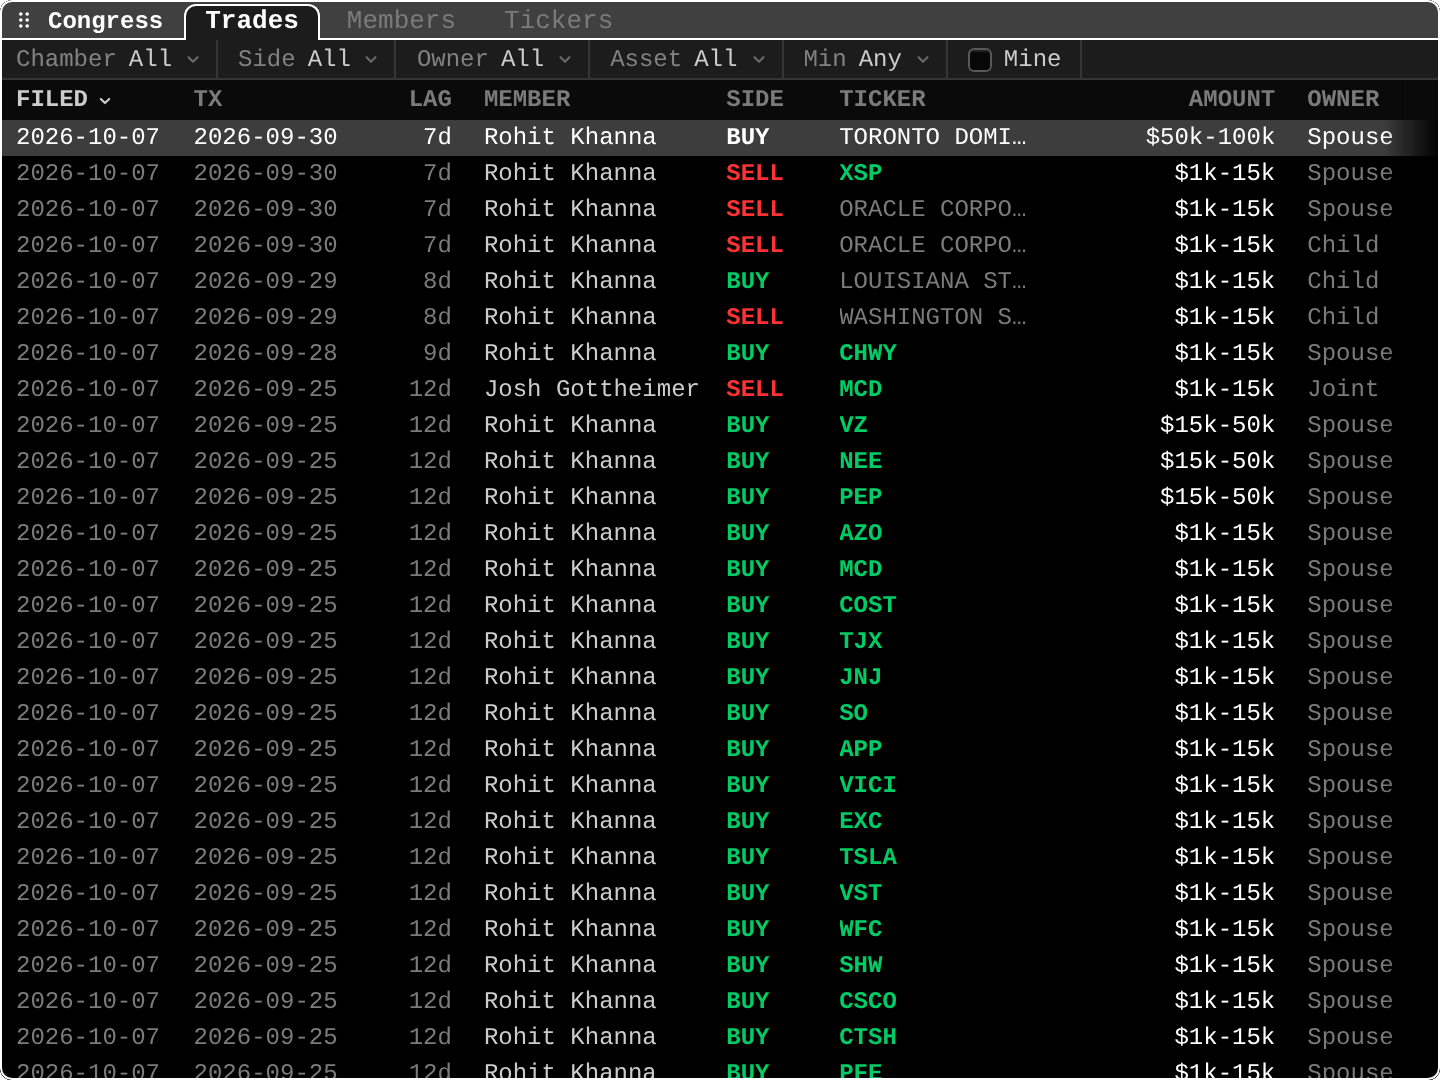
CGCongress trades
House and Senate disclosuresCloudNewly disclosed House and Senate periodic transaction reports: member, ticker, side, amount band, and filing lag, with a Chamber filter. Returns are hindsight price moves, not execution returns.
- Example
CG NVDA - Learn it in the Academy: Congress trades (CG)
- Example
ETFETF filings
A fund's SEC filingsA US-listed fund's SEC filings: registration statements, prospectus updates, shareholder reports, N-CEN and N-PORT reports. Open any of them inline.
- Example
ETF SPY - Learn it in the Academy: A fund's official documents (ETF)
- Example
CLTRSEC comment letters
Staff letters and company repliesSEC staff comment letters and company responses, newest first. Search their text, or type a ticker for one company's letters.
- Example
CLTR revenue recognition - Learn it in the Academy: Litigation and SEC comment letters (LITI, CLTR)
- Example
Run a workspace
12Your own positions and lists.
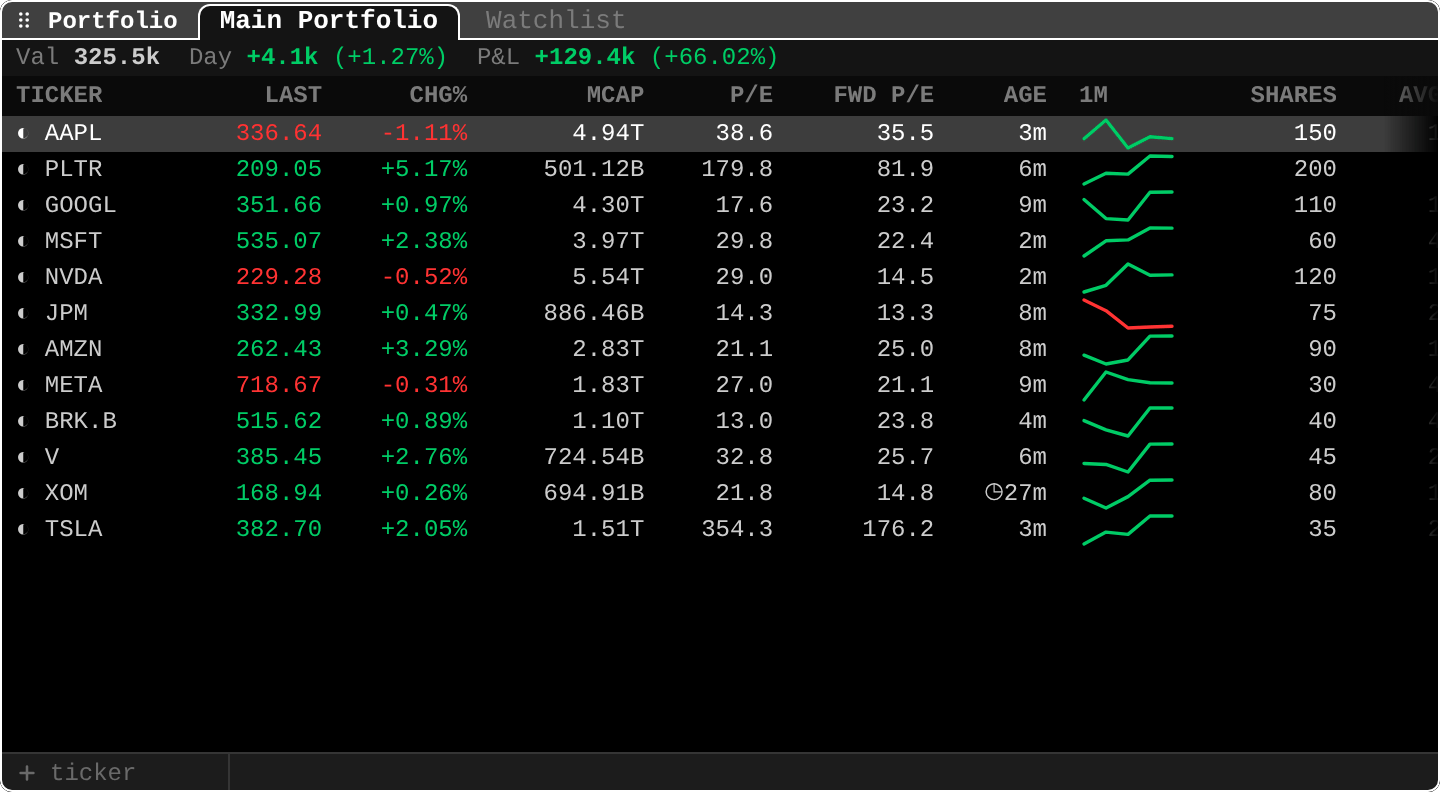
PFPortfolio
Positions with live P&LYour portfolio or watchlist with live quotes, P&L, weights, and sparklines. Set target weights and each holding shows its drift from them and the trade that rebalances it. Broker-synced and manual positions sit in the same table.
- Guide: Portfolios and rebalancing
- Learn it in the Academy: Portfolios and watchlists (PF, AP, AW, RP, RW)
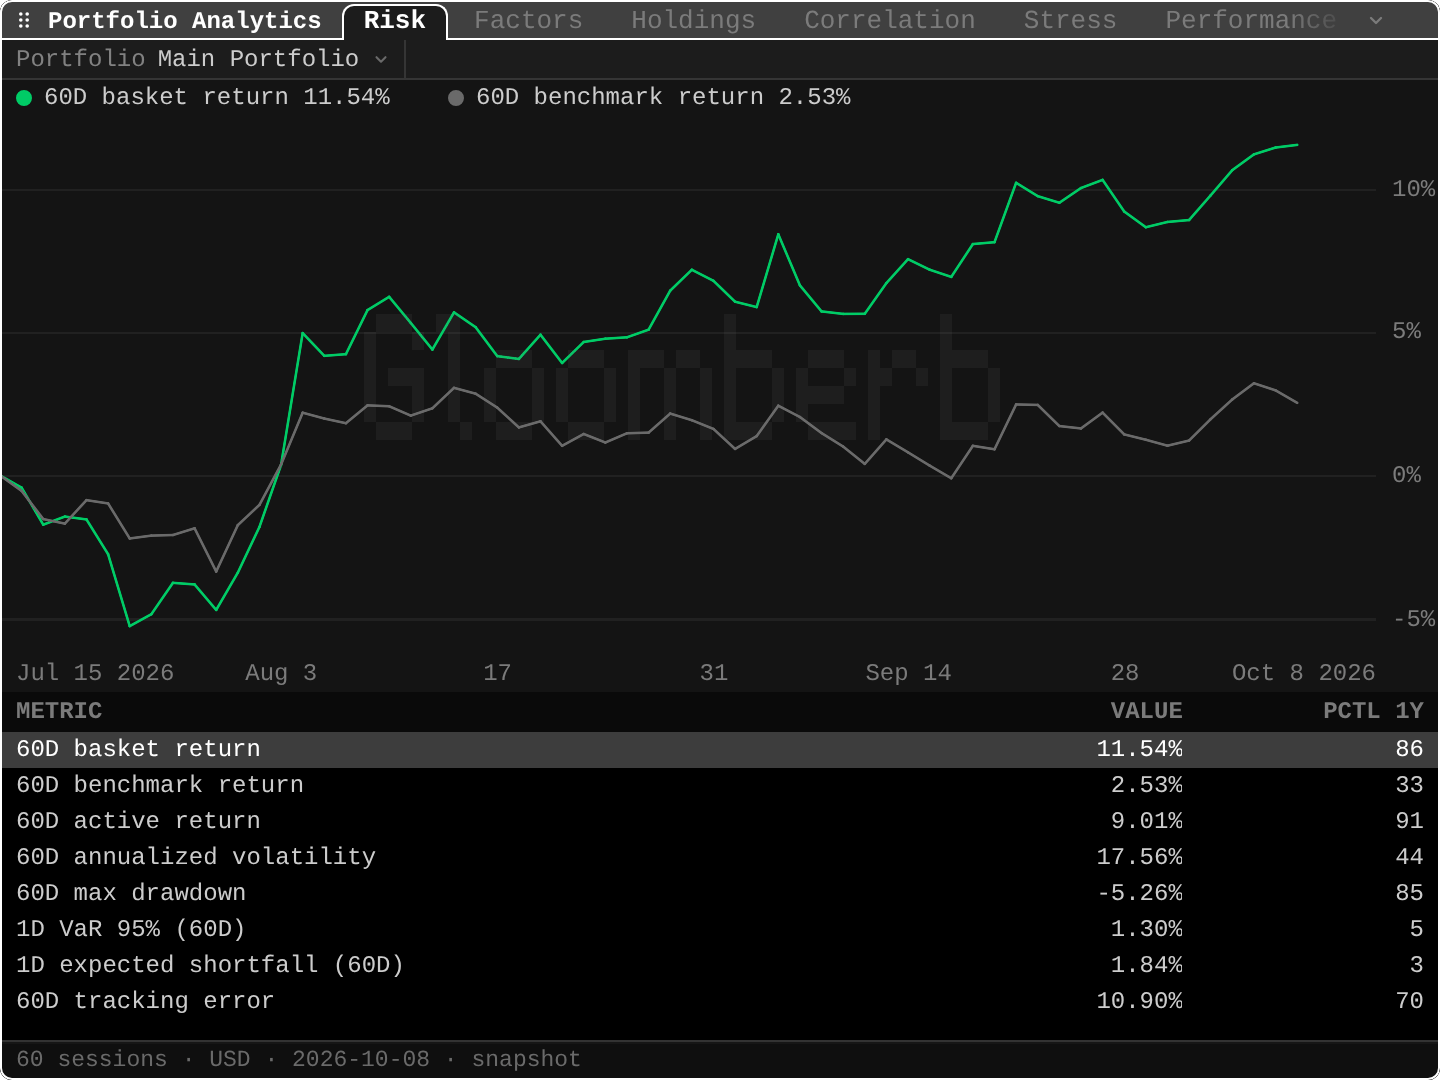
PORTPortfolio analytics
Risk, factor betas, stressOpens on Risk depth: benchmark-relative risk, factor betas, and index, rate, and VIX stress shifts. The Overview view in pane settings has P&L, Sharpe, beta to the S&P 500, and sector allocation. MARS opens it too.
KELLYPosition sizer
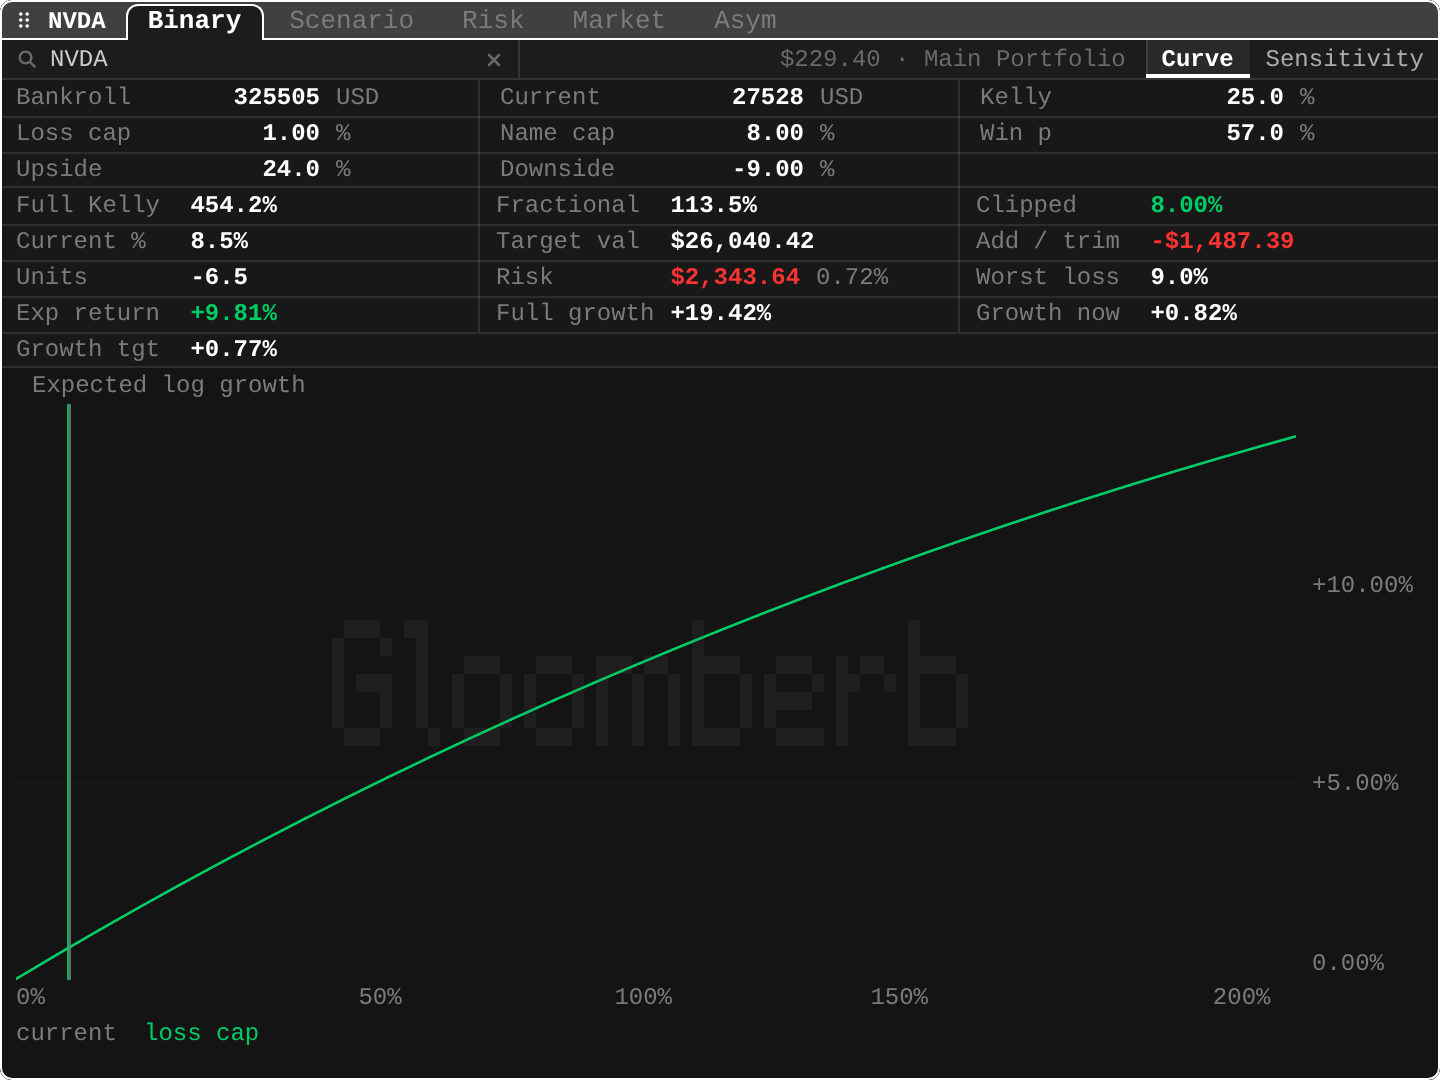
Kelly sizingKelly-based position sizing for a ticker against your bankroll, with loss caps, expected growth, and the trim or add needed.
- Example
KELLY NVDA - Learn it in the Academy: How big a position? (KELLY)
- Example
AWAdd to watchlist
Add a tickerAdds a ticker to the active watchlist.
APAdd to portfolio
Add a tickerAdds a ticker to a manual portfolio, with optional shares, average cost, and currency. Search Set Portfolio Position to change a position later.
RWRemove from watchlist
Remove a tickerRemoves a ticker from the active watchlist.
RPRemove from portfolio
Remove a tickerRemoves a ticker and its positions from the active portfolio.
ALRTAlerts
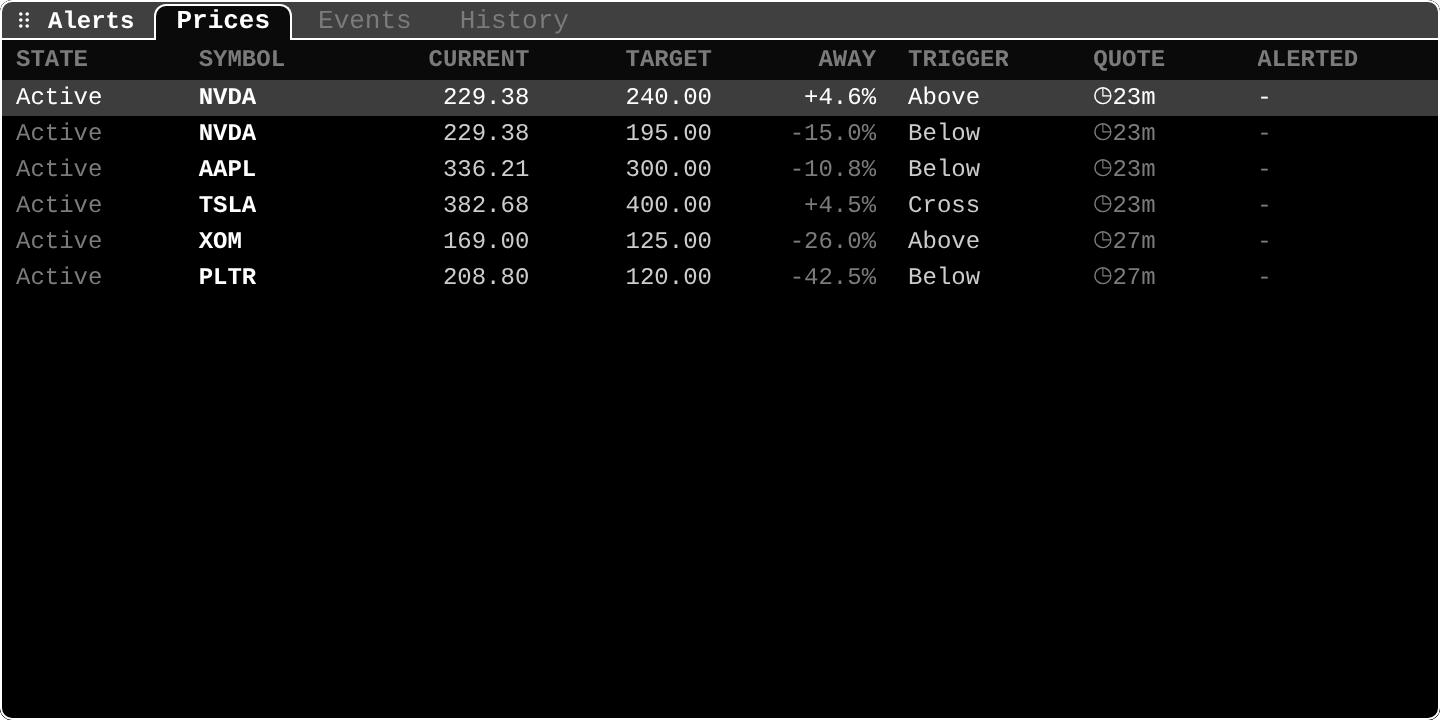
Price, earnings, filing, news and flow alertsPrice alerts with current price, distance to target, and trigger state, plus alerts on earnings, CPI and FOMC dates, filings and 13F, news keywords, analyst changes, 52-week highs and lows, unusual volume, short interest, insider and congress trades, catalysts, IV spikes, options flow, and perps.
SAAdd alert
Create a price alertCreates an alert from a symbol, a condition (above, below, crosses, or >, <, x), and a target price.
- Example
SA NVDA above 240 - Learn it in the Academy: Alerts (ALRT, SA)
- Example
NOTENotes
ScratchpadA general-purpose notes pane. Ticker notes live in the research pane; this one is for anything else.
THESISInvestment theses
Theses and kill conditionsCloudYour theses and your teams', those needing a ruling first: kill conditions, catalysts, and conviction against position size. THESIS NVDA opens or starts one; on Pro it drafts the thesis and watches news and filings.
- Example
THESIS NVDA - Learn it in the Academy: Notes and theses (NOTE, THESIS)
- Example
VIEWCustom view
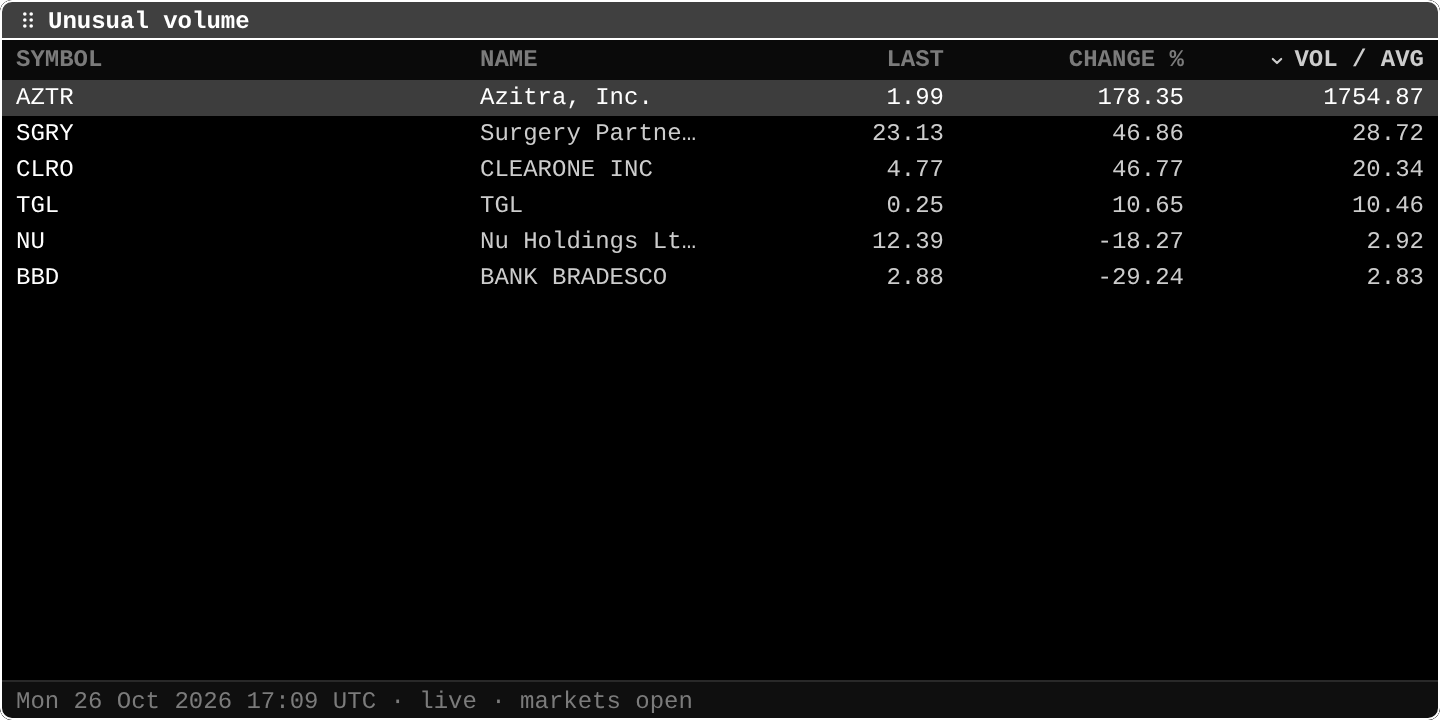
Table from any functionA table built from any data function, like MOST or RV, with your own columns, filters, and sort. Ask Gloom writes the spec or you paste the JSON; publish it to a team.
- Example
VIEW spec JSON - Learn it in the Academy: Make it yours (VIEW, PL, TH, LANG, FONT, SB, VF, CR)
- Example
Cloud and brokers
9Account-backed surfaces.
CHATChat
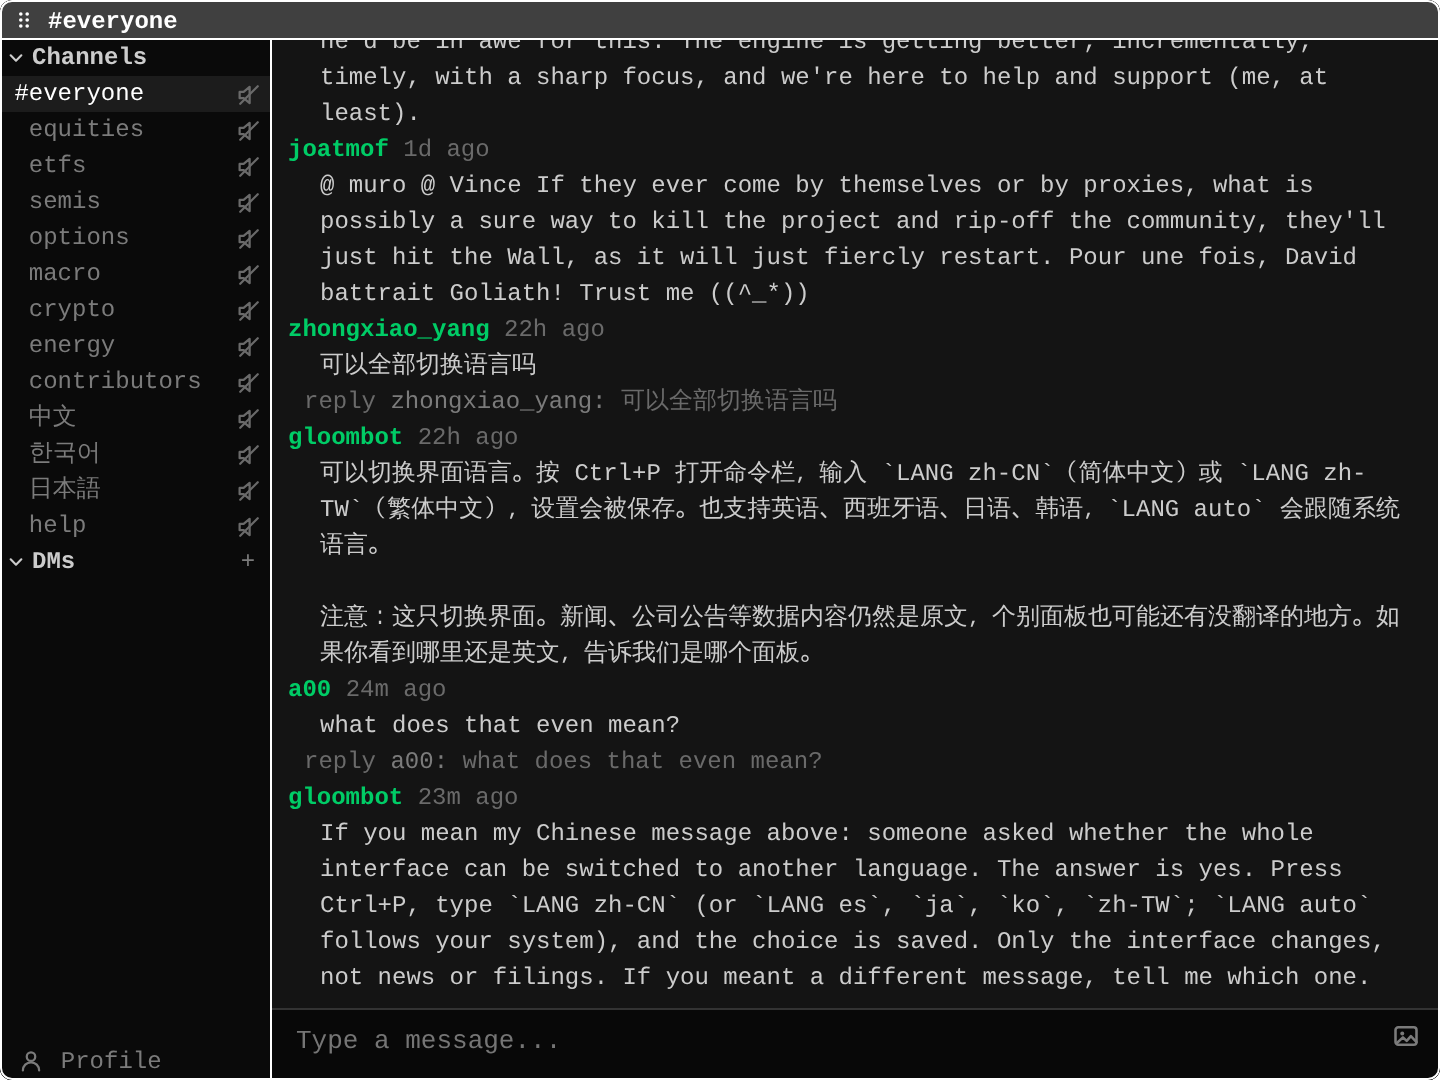
Gloom Cloud channelsCloudChannels for equities, options, macro, crypto, and more, with replies and mentions. Opens the preferred channel or a named one.
- Example
CHAT channel - Learn it in the Academy: Chat and teams (CHAT, DM, TEAM)
- Example
DMDirect messages
Direct or group chatCloudOpens an existing DM or starts a direct or group conversation by username.
- Example
DM @user - Learn it in the Academy: Chat and teams (CHAT, DM, TEAM)
- Example
TEAMTeams
Members, invites, channelsCloudMembers, invites, channels, and settings for your teams, which share layouts, lists, notes, theses, views, and chat. TEAM new creates one (Pro; joining is free); TEAM invite @user adds people.
FOCUSTeam focus
One team, personal, or allCloudNarrows the workspace to one team, personal only, or everything: other tabs fold away and new notes and lists default to the focus. Shown once you are in a team.
- Example
FOCUS personal
- Example
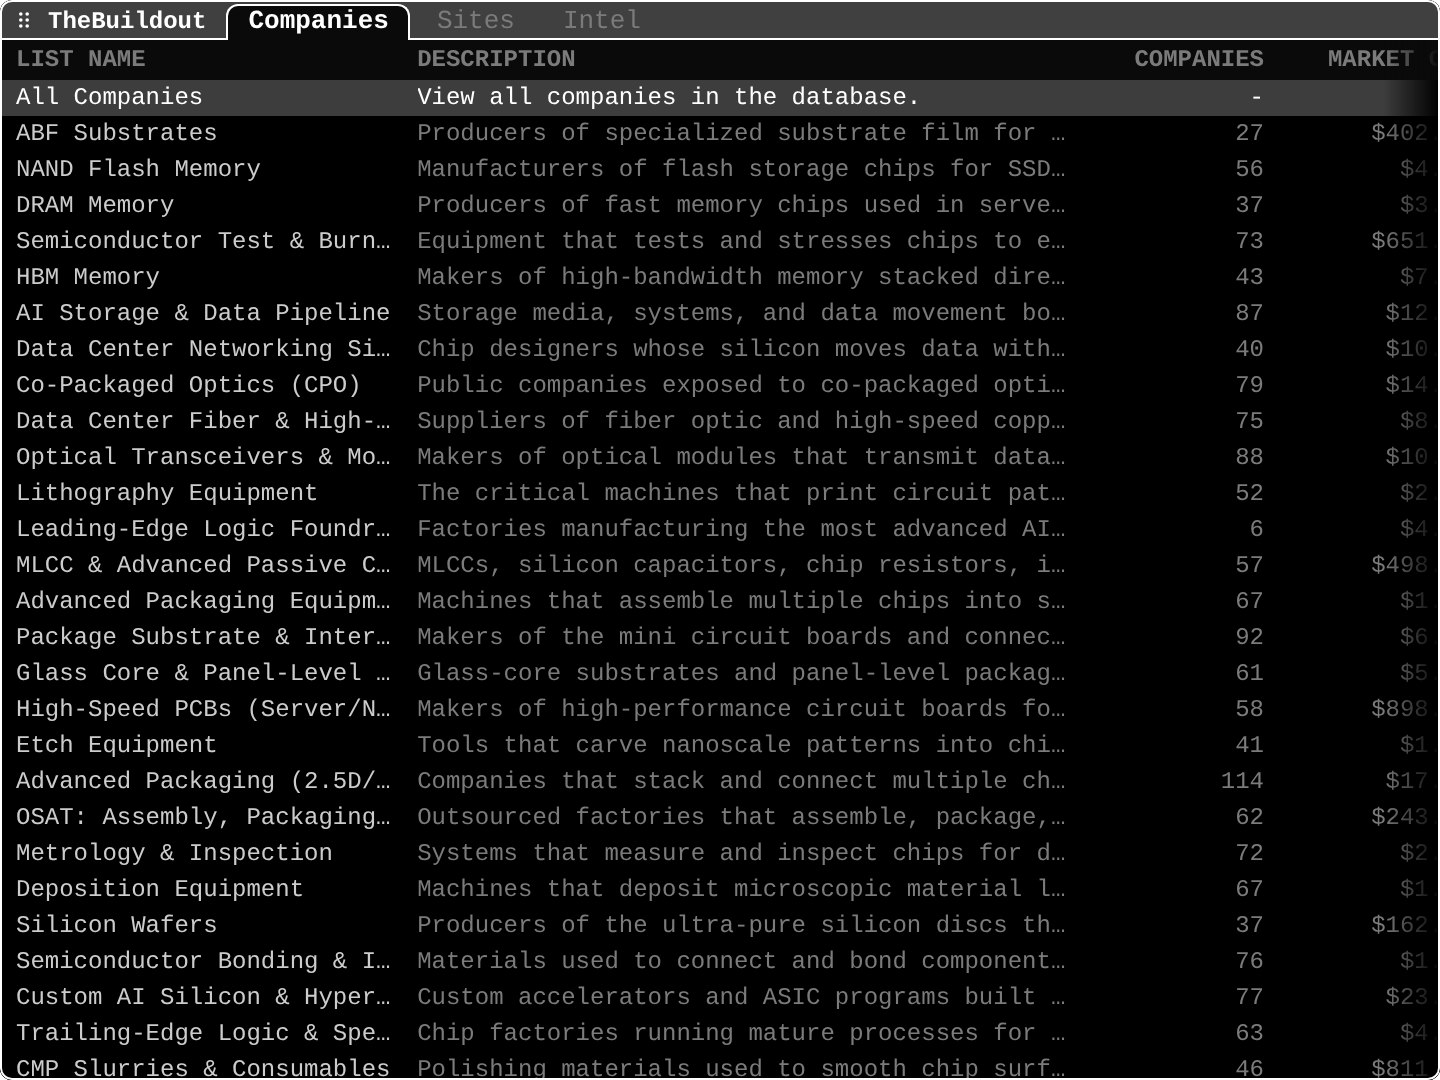
TBOTheBuildout
Infrastructure intelligenceCloudData center and semiconductor supply chain intelligence from TheBuildout: company lists, sites, and intel. Limited free data; full access with a TheBuildout subscription.
ACMAccount management
Profile and settingsCloudProfile, emails, Pro plan, teams, and password settings for your Gloom Cloud account.
UPGRADEUpgrade to Pro
Pro checkoutOpens Pro checkout, or the billing portal during a trial; signs you up first when signed out. Hidden once you pay for Pro; manage the plan in ACM.
BRBrokers
Broker connectionsBroker profiles, account sync, and connection status. Every broker (IBKR, Public, Robinhood, SimpleFIN) is a plugin you install first.
IBKRIBKR trading
Trading consolePluginLive IBKR market data, a trading console and order entry through Gateway or TWS, in the terminal and desktop app only. Open Trading, Buy Selected and Sell Selected prefill a ticket. Orders hit your real account.
Layouts and settings
18Arrange panes, save layouts, manage plugins, and change themes, language, and fonts without leaving the command bar.
GLTidy windows
Tile every windowArranges every open window into one tiled layout.
LAYLayouts
Switch or add layoutsBrowse saved and published layouts, switch between them, or add one to your workspace.
DESKTrading desks
Add a ready-made deskAdds a ready-made desk as a new layout tab: equities, options, futures and commodities, rates and credit, FX and macro, or active trading. Also offered on first run, as 'What do you trade?'.
- Example
DESK options - Learn it in the Academy: Layouts and desks (LAY, DESK)
- Example
LMALayout actions
Organize panesFloat, dock, swap, remove, and save panes and layouts.
- Example
LMA action - Learn it in the Academy: Panes, focus and linking (WIN, GL, PS, LMA)
- Example
WINWindow mode
Move or resize by keyboardMoves or resizes the focused window from the keyboard, for terminals where the mouse is not an option.
- Example
WIN move | resize - Learn it in the Academy: Panes, focus and linking (WIN, GL, PS, LMA)
- Example
PSPane settings
Settings for the focused paneOpens the settings form for whatever pane is focused.
PLPlugins
Install and toggle pluginsThe plugin directory: install from GitHub, and enable or disable the plugins you have.
THTheme
Switch the color themeSwitches between the bundled themes, light and dark.
LANGLanguage
Interface languageSwitches the interface language.
FONT+Font size
Larger or smaller textIncreases the app-wide font size. FONT- decreases it.
SBStatus bar
Toggle the shortcuts barShows or hides the keyboard shortcuts bar at the bottom.
VFValue flashing
Toggle quote flashingTurns the flash on quote updates on or off.
CRChart renderer
Terminal chart modeCycles terminal chart rendering between Auto, Kitty graphics, and Braille.
CONNConnections
Request and socket healthLive request and socket health for every data source.
CHGChangelog
Release notesVersion history and release notes inside the app.
HELPHelp
Shortcuts and referenceKeyboard shortcuts and the command reference.
- Example
HELP OMON - Learn it in the Academy: Getting help (HELP, F1, CHG, FB)
- Example
DOCSDocs
Read the docs in the appThese docs and the Academy lessons, searchable, without leaving the app. The ? on a pane opens that pane's entry; Back returns to where you were.
- Example
DOCS OMON
- Example
FBSend feedback
Report a bug or ideaA message and an optional screenshot, sent with scrubbed logs and app details; works signed out. Also in the status bar and Help, and FEEDBACK or BUG open it too.
No function matches. The command bar in the app searches deeper.
Updated October 7, 2026