The overview page (DES)
DES is the front page of a ticker: quote, day and 52-week ranges, the long chart, returns, key numbers, and tabs into everything else, on one screen.
- 5 min
- 3 questions
- Lesson 1 of 4
Why you would care
What is this company, and what has the price done? A friend says "NVDA is huge now". You want to know: huge compared to what? What does it cost, how far is it from its high, how fast did it get there, and does it earn money?
DESis where you start. Every other page in Gloom hangs off it as a tab.
The idea from scratch
A ticker is the short code for a listed company: NVDA for NVIDIA. A quote is the current price picture for that ticker. It has four parts:
Last
the price of the most recent trade. The big number.
Bid
the highest price a buyer will pay right now.
Ask
the lowest price a seller will accept right now.
Spread
ask minus bid. The gap you cross if you buy and sell straight away.
Illustrative numbers: bid $223.82, ask $223.85, spread $0.03. On a $224 stock that is 0.01%, tiny. The number before the x is the size: how much is wanted or offered at that price.
A range is a low and a high. The day range is today's lowest and highest trade. The 52-week range is the same over the last year. A bar with a dot tells you where the last price sits inside that range: 0% means at the low, 100% at the high.
A return is the change in price as a percentage of where it started. From $100 to $125 is +25%.
See it in Gloom
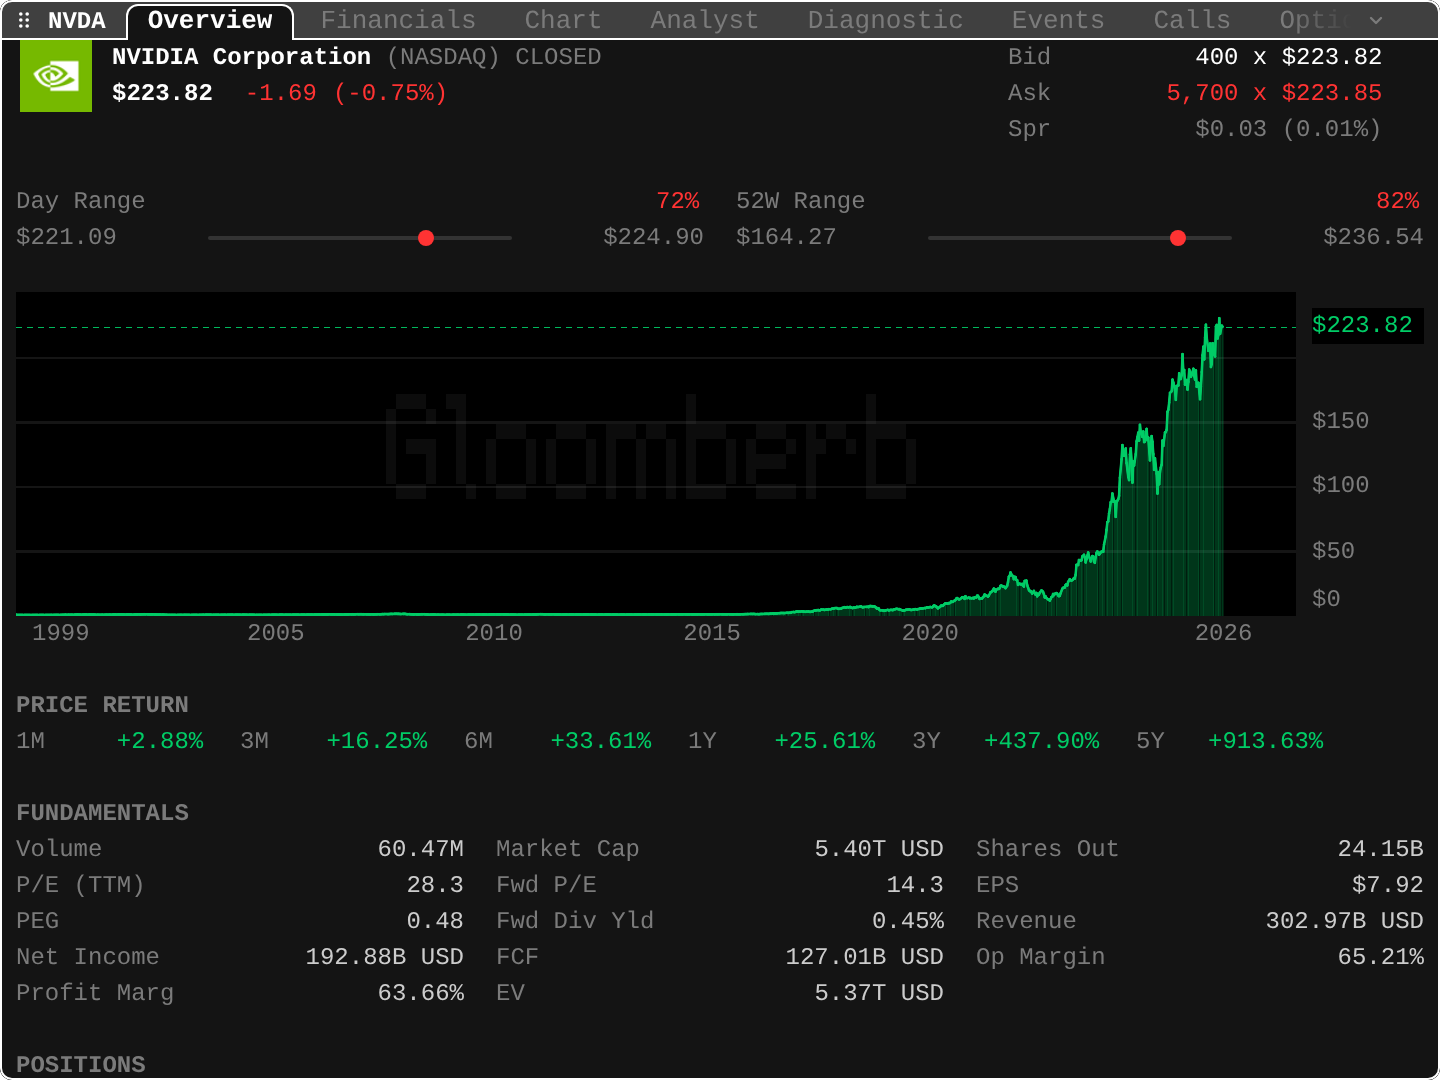
open ittype DES NVDA in the command bar. T NVDA opens the same pane.
The tour, top to bottom:
- Header. Company name, exchange (NASDAQ), market state (CLOSED), last price $223.82, the day's change (-1.69, -0.75%). Red means down today.
- Bid, Ask, Spr.
400 x $223.82is the bid with its size;5,700 x $223.85the ask. Spr is the spread, $0.03 (0.01%). The size is a number of shares (chapter 01, Reading a quote). - Day Range and 52W Range. The dot sits at 72% of today's range and 82% of the year's range. So the price is near the top of both. Newer versions drop the percentage label and keep the marker on a one-row bar, with the price in larger type at the top.
- The chart. The whole listed history, with a dotted line at the current price. Click it to jump to the Chart tab.
- PRICE RETURN. 1M, 3M, 6M, 1Y, 3Y, 5Y changes in price. Here 1Y is +25.61% and 5Y is +913.63%. These are price only, dividends are not added back.
- FUNDAMENTALS. Volume (shares traded today), market cap (price times shares out, 5.40T USD), P/E, EPS, revenue, net income and margins. The profit and revenue figures cover the trailing twelve months (TTM: the latest four reported quarters added up), so
Revenue 302.97Bis a year of sales, not one quarter.Fwd P/Euses analysts' expected earnings instead. Chapter 4 teaches each of these.
Below the fold: Positions (your own holdings in this ticker, if any), Profile and Description.
The tabs across the top (Financials, Chart, Analyst, Diagnostic, Events, Calls, Options, and more) open the other research panes for the same ticker. Press h and l to move between tabs, or . to jump to one by name. Funds, coins and indices show fewer tabs because less data exists for them.
Practice and recap
Try it3 tasks
- With the screenshot above, compute where $223.82 sits in the day range $221.09 to $224.90. (Hint: distance from the low divided by the size of the range.)
- Find the spread as a share of the price: $0.03 divided by $223.82.
- Read the 3Y return. Does it match the shape of the chart from 2023 to 2026?
Common mistakes4 mistakes
- Reading the 5Y return as "per year". +913% over 5 years is the total, not a yearly rate.
- Treating the day range as a forecast. It is just where trades happened today.
- Comparing market caps across currencies without noticing the currency label (here
USD). - Forgetting the quote may be 15 minutes old on the free plan.
Check yourself3 questions
- What is the spread if the bid is $100.00 and the ask is $100.04?
- A stock's 52-week range is $50 to $100 and the dot shows 50%. What is the price?
- Which section would you read to see how the price moved over the last 6 months?
Answers
- $0.04.
- $75, halfway between the low and the high.
- PRICE RETURN, the 6M column.
Words in this lesson12 words
- ticker
- the short code for a listed company or fund
- quote
- the current price picture: last, bid, ask, change
- last
- the price of the most recent trade
- bid
- the highest price a buyer will pay right now
- ask
- the lowest price a seller will accept right now
- spread
- ask minus bid
- size
- how many are wanted or offered at the bid or ask
- day range
- today's lowest and highest trade
- 52-week range
- the lowest and highest trade over the last year
- return
- price change as a percentage of the starting price
- market cap
- price times number of shares: the value of the whole company
- volume
- number of shares traded in a period
Educational material about reading market data, not investment advice.