Is implied vol high or low? (HIVG, VCA)
HIVG charts a stock's implied volatility history with IV rank and percentile, and VCA ranks a list of tickers as rich, fair or cheap on those and a few other clues.
- 4 min
- 3 questions
- Lesson 3 of 4
Why you would care
Is implied volatility high or low for this stock? An IV of 40% is low for a biotech and high for a utility. The only fair comparison is a stock against its own past. IV rank and IV percentile turn that comparison into one number each, and they are the first thing many option traders look at.
The idea from scratch
IV rank
Where today's IV sits between its lowest and highest value of the past 52 weeks:
IV rank = (IV now - 52-week low) / (52-week high - 52-week low) x 100
IV percentile
The share of the past year's days when IV was below today's level. Same example: if IV was below 30% on 40% of days, IV percentile = 40.
Why both? One extreme spike (a crash) stretches the range and makes IV rank look low for months; the percentile is less sensitive to a single spike.
Other clues VCA uses
Term slope (30-90)
30-day IV minus 90-day IV. Positive: near-term event or stress priced in.
25-delta skew
put IV minus call IV (previous lesson).
IV/HV
implied over realized (20-day here). Above 1: options price more movement than the stock showed.

See it in Gloom
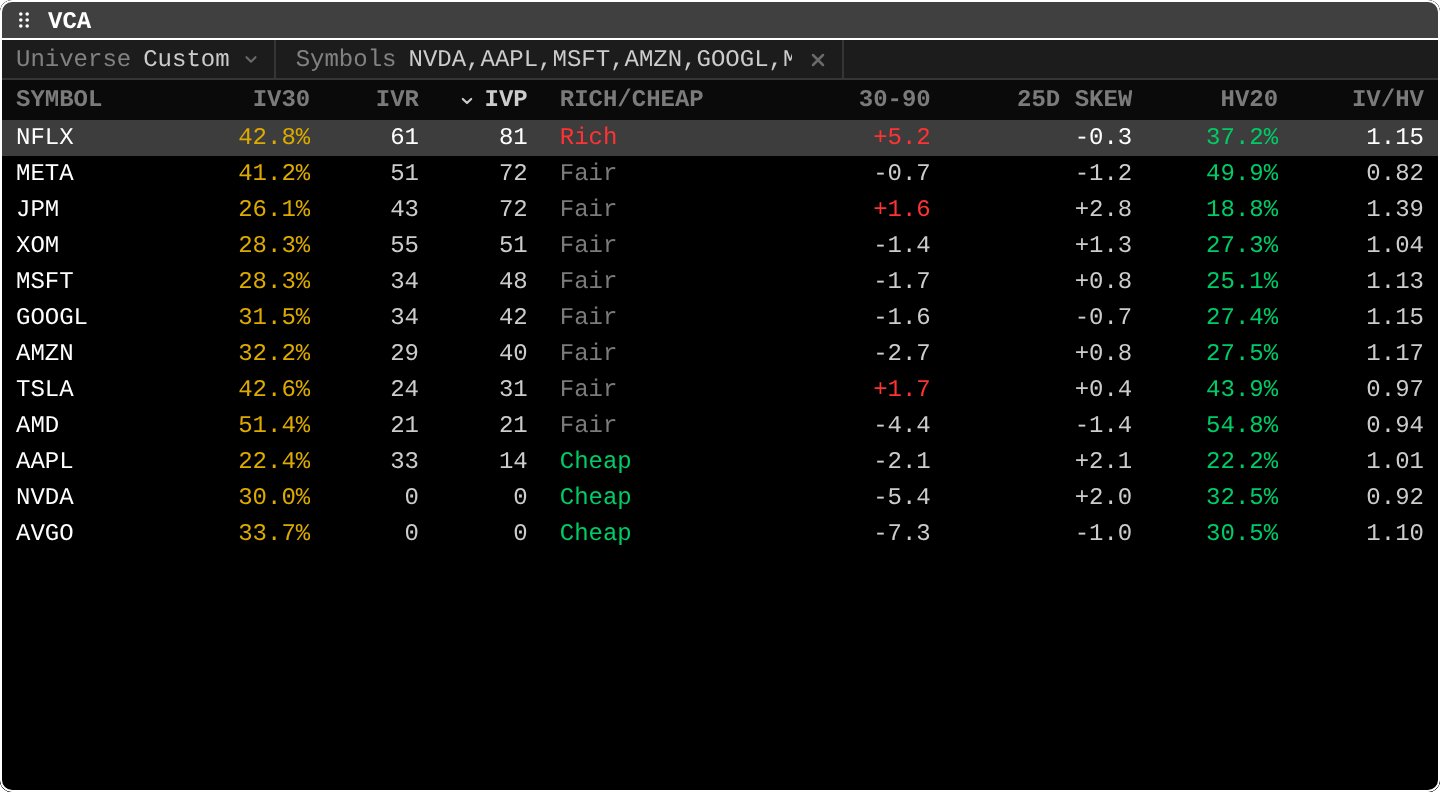
open ittype VCA NVDA, AAPL, MSFT, ... for your list, or VCA alone for index and sector ETFs. HIVG NVDA for one stock's history. Enter opens a row.
NFLX 42.8% IVR 61 IVP 81 Rich: Netflix's implied vol is higher than on 81% of the past year's days.30-90 +5.2for NFLX: 30-day IV well above 90-day: something near-term is priced (often an earnings date).NVDA 30.0% 0 0 CheapandAVGO ... 0 0 Cheap: implied vol at the lowest of the past year.IV/HV: JPM1.39(options rich against recent moves), META0.82(cheap against recent moves): the two measures can disagree with the rank.25D SKEW: JPM +2.8 (puts richer), NVDA +2.0.
Practice and recap
Try it3 tasks
- IV range 25% to 75% over a year, today 35%. IV rank? ((35 - 25) / 50 x 100 = 20.)
- In the screenshot, which name is cheap by rank but rich by IV/HV? (AVGO: rank 0, IV/HV 1.10.)
- Why might NFLX show a positive 30-90 slope? (A near-term event, likely earnings, inside the 30-day window.)
Common mistakes4 mistakes
- Treating "cheap" as a reason to buy options: IV can stay low for months.
- Ignoring events: a high IV rank before earnings is normal.
- Comparing IV rank across stocks with very different histories.
- Forgetting that one crash day can distort IV rank for a year.
Check yourself3 questions
- Define IV rank in words.
- How is IV percentile different?
- What does a positive 30-90 term slope suggest?
Answers
- Where today's implied vol sits between its 52-week low (0) and high (100).
- It is the share of past days with lower IV, less sensitive to a single spike.
- Near-term implied vol above longer-term: an event or stress expected soon.
Words in this lesson5 words
- IV rank (IVR)
- Position of today's IV in its 52-week range, 0 to 100.
- IV percentile (IVP)
- Share of past days with IV below today's.
- rich / cheap (vol)
- IV high / low against the stock's own history.
- term slope
- Short-dated IV minus longer-dated IV.
- ATM IV
- Implied vol of at-the-money options.
Educational material about reading market data, not investment advice.