The volatility surface and skew (OVDV)
Implied volatility changes with the strike (the skew) and with the expiry (the term structure), and OVDV fits the whole surface from option quotes.
- 4 min
- 3 questions
- Lesson 1 of 4
Why you would care
"NVDA vol is 30%." Which one? Short-dated puts may be at 40%, one-year calls at 28%. Traders talk about the shape, not a single level. The shape tells a story: fear of a crash, an event on a date, a market that expects calm to return.
The idea from scratch
Across strikes: smile and skew
Take one expiry and plot implied volatility against strike. For stocks and indices the curve usually slopes down to the right: low-strike puts are more expensive in volatility terms than high-strike calls. That tilt is the skew (or "smirk").
Why: investors buy puts as crash insurance, and crashes are faster than rallies. Insurance costs extra.
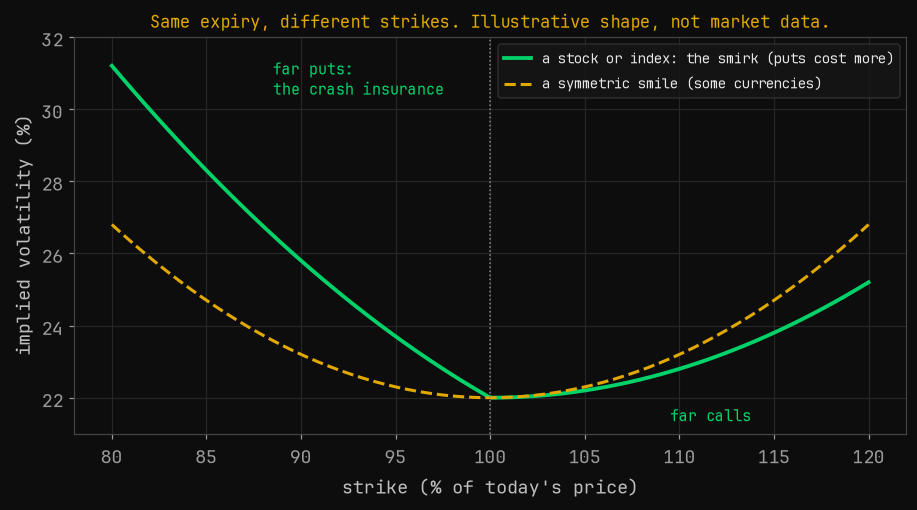
A common way to measure skew: the 25-delta skew = implied vol of the 25-delta put minus implied vol of the 25-delta call (both about equally far out of the money).
Across expiries: term structure
Plot at-the-money IV against expiry. Usually it rises with time in calm markets (more can happen over a year). Before an event (earnings) the expiry just after it jumps up. In a panic, short-dated vol shoots above long-dated vol (the curve inverts).
The surface
Both together: strike (or delta) on one axis, expiry on another, IV as height. Gloom fits a smooth surface through the quotes so you can read any point.

See it in Gloom
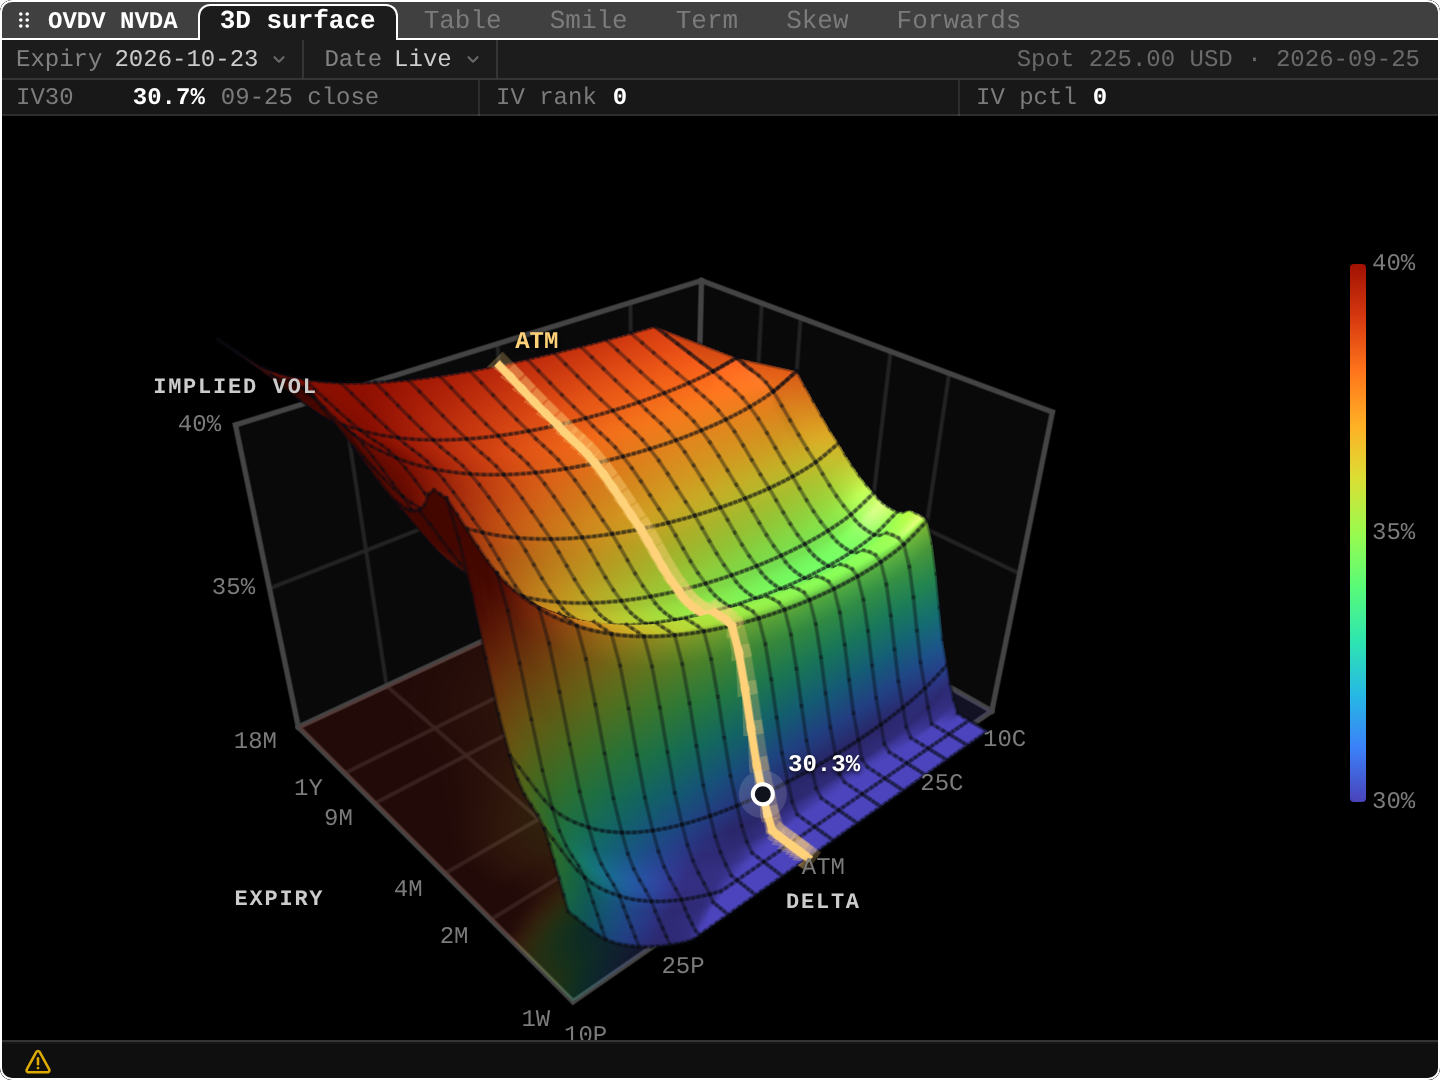
open ittype OVDV NVDA. Tabs: 3D surface, Table, Smile, Term, Skew, Forwards. Keys: v view, c chain, m more expiries, t stored dates (the surface as of a past close).
IV30 30.7% 09-25 close: the 30-day at-the-money IV at the last close.IV rank 0,IV pctl 0: implied vol at the very bottom of its past year.- The highlighted
ATMline: IV rises from about 30% at 1 week to about 40% at 18 months. Upward term structure: calm now, more uncertainty priced further out. - The left edge (toward
10P, low-strike puts): higher than the right edge (10C): the skew. - The marked point
30.3%: the selected expiry's at-the-money IV.
Practice and recap
Try it3 tasks
- In the screenshot, is short-dated or long-dated vol higher? (Long-dated: about 40% vs 30%.)
- 25-delta put IV 34%, 25-delta call IV 29%. 25-delta skew? (+5 points.)
- Earnings are in 3 weeks. Which expiry on the Term tab do you expect to stick out? (The first one after the report date.)
Common mistakes4 mistakes
- Quoting "the" IV without strike and expiry.
- Reading skew as a forecast of a fall. It is the price of protection.
- Comparing smiles across stocks without normalizing by delta or moneyness.
- Ignoring events inside an expiry.
Check yourself3 questions
- What is the skew?
- What does an inverted term structure suggest?
- Why are low-strike puts usually priced at higher IV?
Answers
- How implied vol changes across strikes for one expiry; for stocks, puts are usually richer than calls.
- Stress now: short-dated options price more movement than long-dated ones.
- Investors buy them as crash insurance, and markets fall faster than they rise.
Words in this lesson6 words
- volatility surface
- Implied vol by strike (or delta) and expiry.
- smile / skew
- IV across strikes; skew is its tilt.
- 25-delta skew
- IV of the 25-delta put minus IV of the 25-delta call.
- term structure
- At-the-money IV across expiries.
- inverted (backwardated) term structure
- Short-dated IV above long-dated IV.
- moneyness
- How far a strike is from the current price, often as a %.
Educational material about reading market data, not investment advice.