World indices and trading hours (WEI, MAP)
WEI lists the main stock indices of the Americas, Europe and Asia-Pacific with their level, change and session status, and MAP shows every trading venue on a world map.
- 4 min
- 3 questions
- Lesson 1 of 6
Why you would care
Which markets are open, and how did each one do? Markets pass the baton around the globe: Asia trades while New York sleeps, Europe opens before the US. A big move in Tokyo overnight often sets the tone for the US open. Knowing which markets are open, and how they did, is the first glance of the trading day.
The idea from scratch
Each country has benchmark indices (chapter 01, Funds, ETFs and indices): a measuring rule for a group of stocks. The main ones:
| Region | Examples |
|---|---|
| Americas | S&P 500, Dow Jones Industrial Average, Nasdaq Composite, Russell 2000 (small companies), S&P/TSX (Canada), Bovespa (Brazil) |
| Europe | FTSE 100 (UK), DAX (Germany), CAC 40 (France), Euro Stoxx 50 (euro area), SMI (Switzerland) |
| Asia-Pacific | Nikkei 225 (Japan), Hang Seng (Hong Kong), Shanghai Composite, KOSPI (Korea), ASX 200 (Australia), Sensex (India) |
Two "other" lines matter to everyone:
VIX
the market's 30-day implied volatility (chapter 06).
DXY (US dollar index)
the dollar against a basket of major currencies.
The trading day around the world
Each exchange has its own hours in its own time zone, plus lunch breaks in some Asian markets and holidays. A venue is identified by its MIC (market identifier code), like XNYS for the NYSE or XASX for the Australian exchange.

See it in Gloom
open themtype WEI for indices, MAP for the venue map.
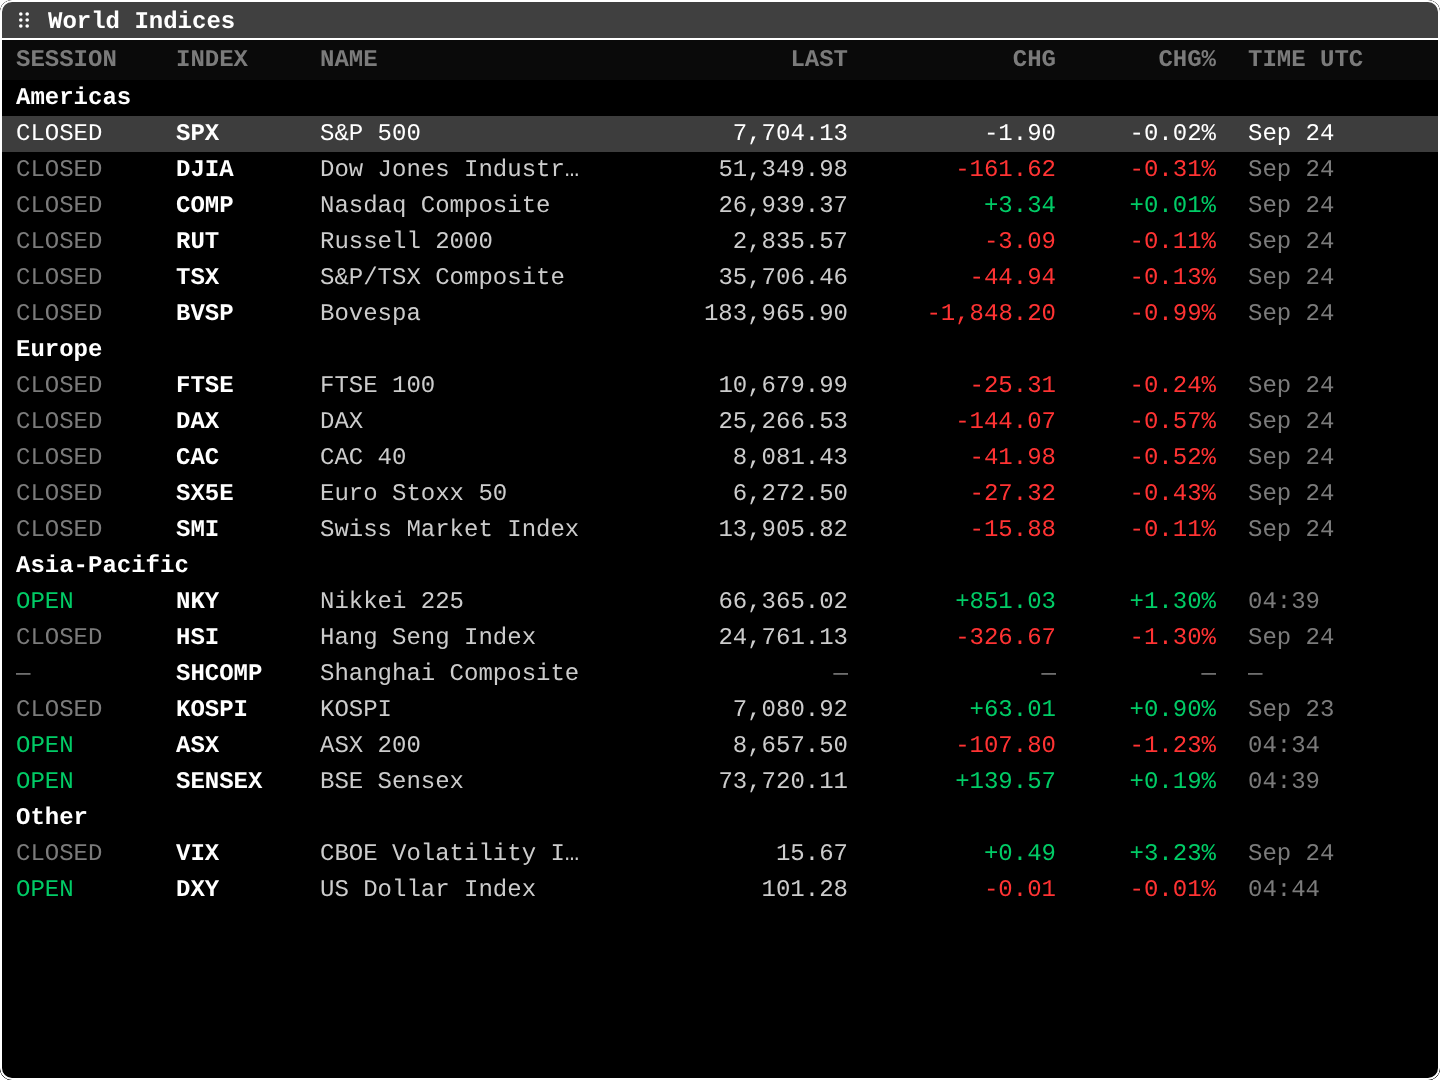
SESSION:OPENfor Nikkei, ASX and Sensex at 04:39 UTC;CLOSEDelsewhere, with the previous session's numbers.SPX S&P 500 7,704.13 -1.90 -0.02%: the last US close.NKY Nikkei 225 66,365.02 +851.03 +1.30%: Tokyo up strongly while the US sleeps.SHCOMPwith dashes: no data at capture.DXY 101.28: the dollar index, trading almost around the clock.
- In
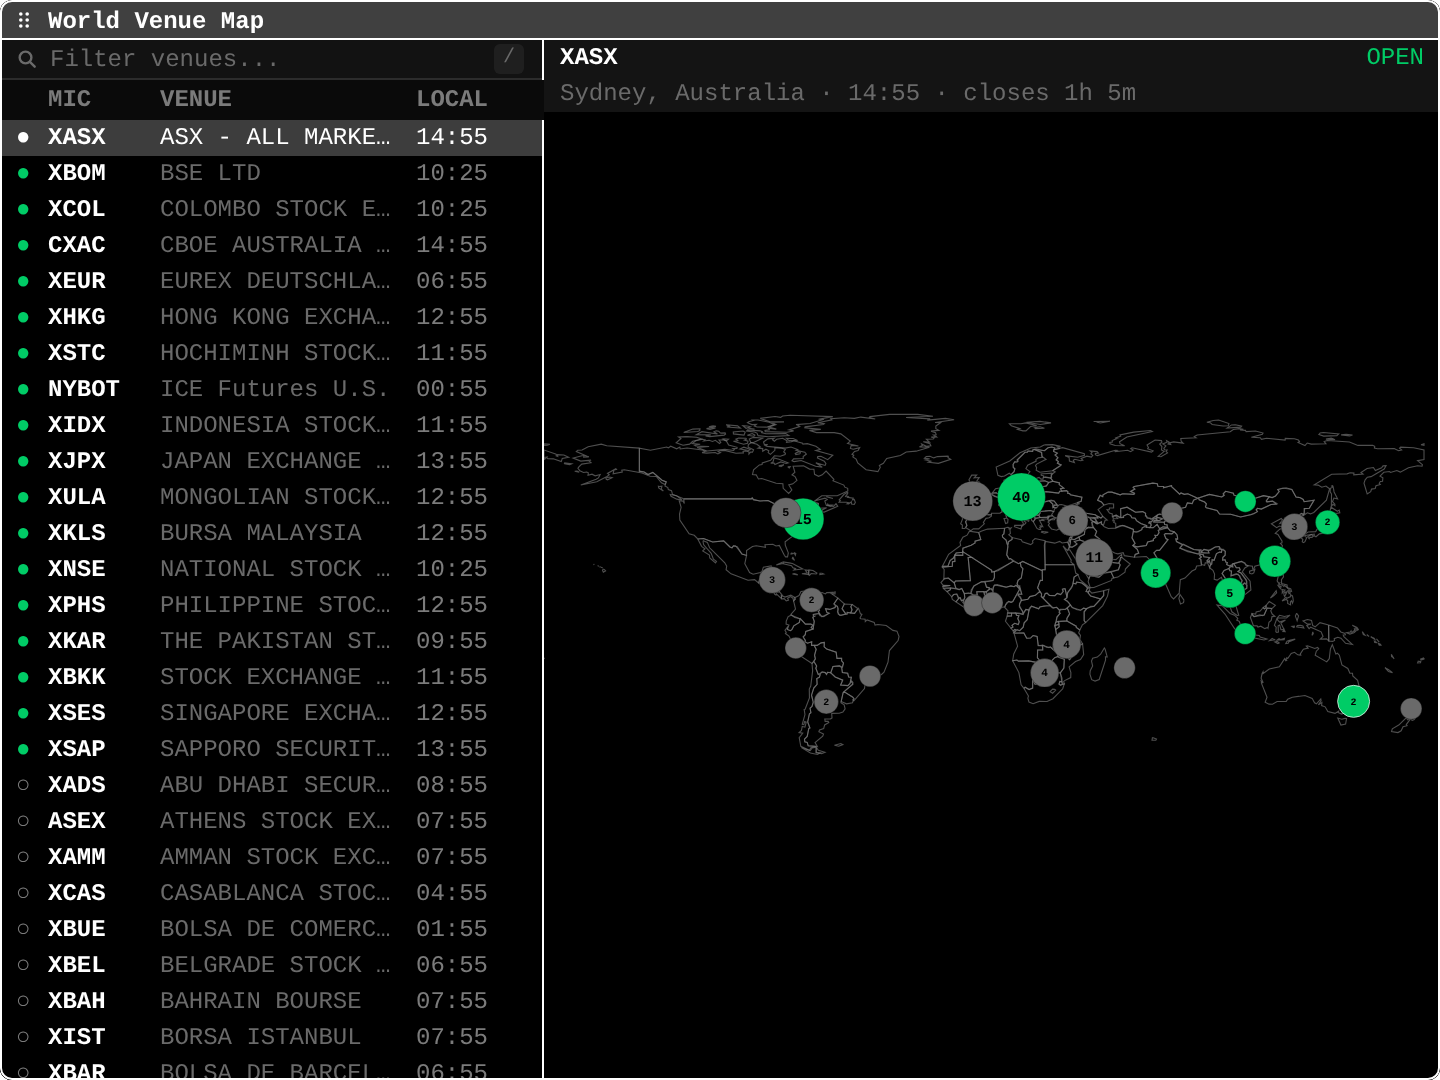
MAP:XASX Sydney, Australia · 14:55 · closes 1h 5m: the selected venue, its local time and time to close; green dots and numbers count open venues per area.
Practice and recap
Try it3 tasks
- In WEI, which region was trading at capture? (Asia-Pacific: Nikkei, ASX, Sensex.)
- Which European index fell most on its last session? (DAX, -0.57%.)
- In MAP, what is XBOM? (BSE Ltd, the Bombay Stock Exchange.)
Common mistakes4 mistakes
- Comparing an open market's live level with closed markets' old closes as if they were simultaneous.
- Forgetting time zones and holidays.
- Reading the Dow (30 stocks, price-weighted) as the whole US market.
- Ignoring currency: a Nikkei rise in yen is not the same return in dollars.
Check yourself3 questions
- What does DXY measure?
- What is a MIC?
- Why does a closed index still show a change?
Answers
- The US dollar against a basket of major currencies.
- A market identifier code for a trading venue, like XNYS.
- It shows the change of its last completed session.
Words in this lesson5 words
- benchmark index
- The standard index for a market, like the S&P 500.
- DXY
- The US dollar index.
- venue
- A place where trading happens: an exchange or similar.
- MIC
- Market identifier code of a venue.
- local time
- The time in the venue's own time zone.
Educational material about reading market data, not investment advice.