The yield curve and its spreads (GC)
GC draws government yield curves for the US (nominal and real), Germany, the UK, Japan, Canada and the euro AAA curve, with the main slope spreads and their changes.
- 4 min
- 3 questions
- Lesson 1 of 6
Why you would care
Are rates rising or falling, and is the curve steepening or flattening? The yield curve is the most watched chart in finance. Its level sets mortgage rates and company borrowing costs; its slope is read as a signal about growth and the central bank. "The curve steepened 10 bp after the jobs report" is a sentence you should be able to see on screen.
The idea from scratch
From chapter 01, Bonds in one page: a yield curve lines up a government's bond yields from short to long maturities. The rates desk talks about it with a few tools:
Level, slope, curvature
Level
are all yields high or low?
Slope
the difference between long and short yields. The classic measure is 2s10s = 10-year yield - 2-year yield, in basis points. Others: 3m10y, 5s30s.
Curvature
is the middle (around 5 years) above or below a straight line between the ends?
Slope moves have names:
- Steepening
- Long yields rise relative to short ones (the spread widens)
- Flattening
- The spread narrows
- Inversion
- Short yields above long yields: a negative 2s10s
Real yields and breakevens
TIPS are Treasuries whose principal grows with inflation; their yield is a real yield (after inflation). Breakeven inflation = nominal yield - real yield at the same tenor: the inflation rate at which both bonds would pay the same. It is a market price, not a forecast.
Across countries
Each government has its own curve. Differences reflect central bank rates, inflation, growth and credit risk.

See it in Gloom
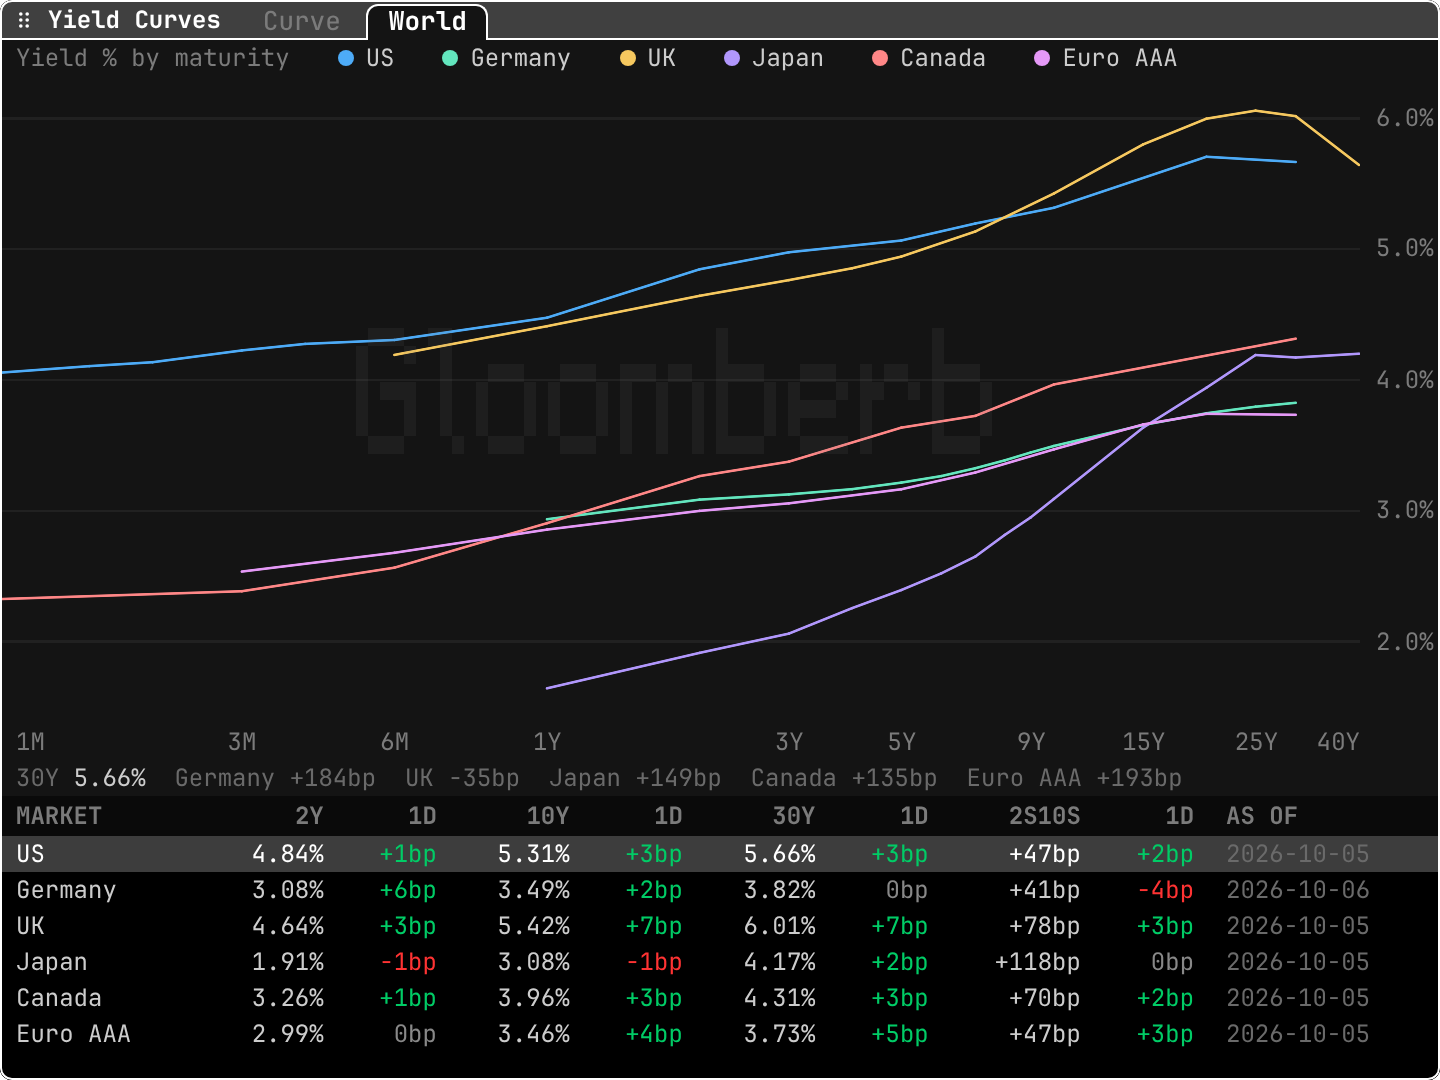
open ittype GC (tabs Curve and World). On the Curve tab: d sets an as-of date, v a compare date (or 1W, 3M, 1Y), and a 1-year forward overlay; c returns to the latest curve.
US 2Y 4.84% 10Y 5.31% 30Y 5.66% 2s10s +47bp: an upward-sloping US curve.Japan 1.91% 3.08% 4.17% +118bp: much lower level, but the steepest slope.UK 30Y 6.01%: the highest long-end yield of the group.- Under the chart:
30Y 5.66% Germany +184bp UK -35bp: at the cursor (30Y), the US yields 184 bp more than Germany and 35 bp less than the UK. AS OF: each market's own session date (Germany 2026-10-06, others 2026-10-05).
The Curve tab (screenshot in Bonds in one page) adds the spreads with their one-year percentile; a negative spread is shown as a warning (inversion).
Practice and recap
Try it3 tasks
- Compute Germany's 2s10s from the table. (3.49 - 3.08 = 0.41 = +41 bp, matching the table.)
- Which market has the flattest curve between 2Y and 10Y? (Germany, +41 bp; the US and the euro AAA curve follow at +47 bp.)
- Nominal 10Y 5.31%, real 10Y 2.90% (illustrative). 10-year breakeven? (2.41%.)
Common mistakes4 mistakes
- Saying "rates rose" without a tenor: short and long rates often move differently.
- Reading inversion as a precise recession timer.
- Treating breakeven inflation as an inflation forecast (it includes risk premia).
- Comparing curves across countries without currency context.
Check yourself3 questions
- What is 2s10s?
- What is a flattening?
- How is breakeven inflation computed?
Answers
- The 10-year yield minus the 2-year yield, in basis points.
- A narrowing of the gap between long and short yields.
- Nominal yield minus real (TIPS) yield at the same tenor.
Words in this lesson6 words
- level / slope / curvature
- How high / how steep / how bent the curve is.
- 2s10s, 3m10y, 5s30s
- Yield spreads between two tenors, in bp.
- steepening / flattening
- The long-short spread widens / narrows.
- TIPS
- Inflation-protected Treasuries.
- real yield
- Yield after inflation, from TIPS.
- breakeven inflation
- Nominal minus real yield.
Educational material about reading market data, not investment advice.