The economic calendar (ECO)
ECO lists upcoming and recent economic releases and central bank events by time, with their impact and the actual, forecast and prior numbers.
- 4 min
- 3 questions
- Lesson 1 of 4
Why you would care
What data comes out today, and how did it compare with expectations? Every trader starts the day by checking the calendar. A jobs report or a central bank decision can move every market at once, and you want to know before it happens, not after. The calendar also tells you what "surprise" means for each number: the gap between actual and forecast.
The idea from scratch
Governments and central banks publish data on a fixed schedule: inflation, jobs, retail sales, business surveys, trade, housing, rate decisions, and speeches by officials.
For each release the calendar shows:
- Actual
- The number just published
- Forecast
- The consensus: the median of economists' forecasts
- Prior
- The previous release (sometimes revised)
- Impact
- How much this release usually moves markets: low, medium, high
The market reacts to the surprise: actual minus forecast (chapter 01, How information reaches prices and The macro machine).
Not every number is "good when higher": higher unemployment claims are bad news for the economy; higher inflation can be bad for bonds.

See it in Gloom
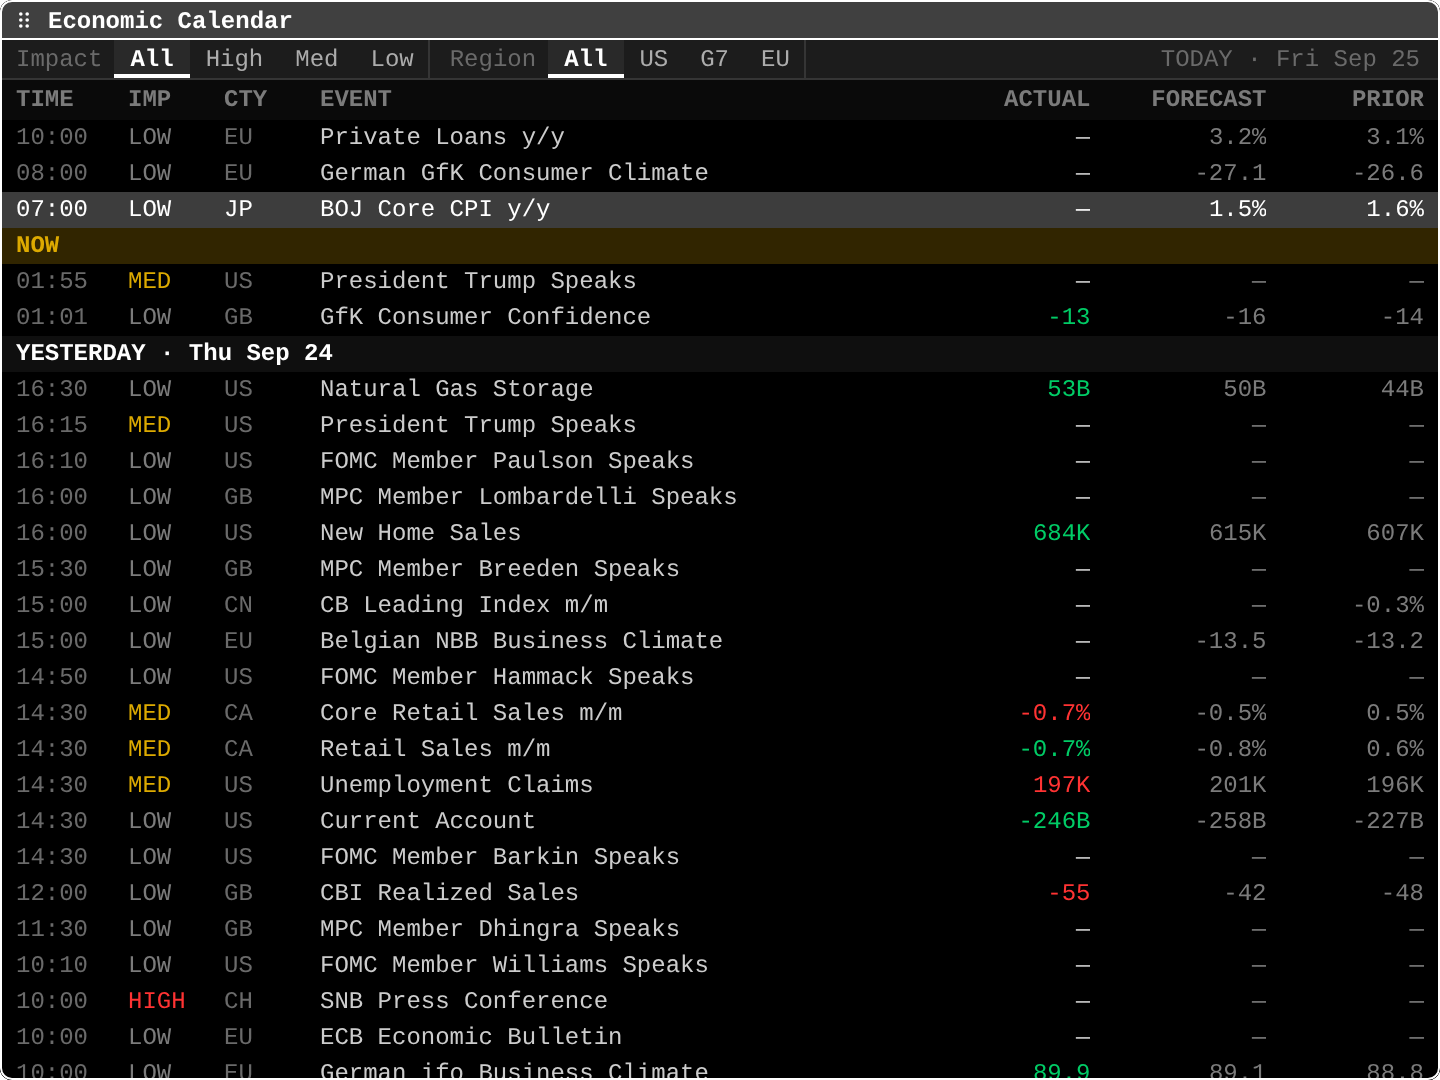
open ittype ECO. Filters on top: Impact (All, High, Med, Low) and Region (All, US, G7, EU). f cycles impact, c region, Enter opens an event.
- The
NOWline: everything above it is still to come today. 07:00 LOW JP BOJ Core CPI y/y, no actual yet, forecast1.5%, prior1.6%: a Japanese inflation figure that is not out yet.14:30 MED US Unemployment Claims 197K 201K 196K: actual below forecast, shown in red (red and green show below or above the forecast, not good or bad).16:00 LOW US New Home Sales 684K 615K 607K: a big upside surprise.10:00 HIGH CH SNB Press Conference: a central bank event; events like speeches have no numbers.- Times are in your computer's local time: here 14:30 is 8:30 in New York.
Practice and recap
Try it3 tasks
- Which US release in the screenshot surprised most, in percent? (New home sales: 684K vs 615K, about +11%.)
- Is a lower-than-forecast unemployment-claims number good or bad for the economy? (Good: fewer people lost jobs.)
- Why do speeches by officials appear on an economic calendar? (They can change expectations for interest rates.)
Common mistakes4 mistakes
- Reading the color as good or bad news; it shows only above or below the forecast.
- Ignoring revisions to the prior number, which can matter as much as the new one.
- Forgetting time zones.
- Treating low-impact releases as irrelevant on quiet days: they can still move a single market.
Check yourself3 questions
- What three numbers does each release show?
- What is the surprise?
- Why can a higher number be bad news?
Answers
- Actual, forecast (consensus) and prior.
- Actual minus forecast.
- Some indicators measure bad things (unemployment claims, inflation): more of them is worse.
Words in this lesson5 words
- economic calendar
- The schedule of data releases and central bank events.
- actual / forecast / prior
- The released number / the consensus / the previous release.
- impact
- How much a release usually moves markets.
- revision
- A change to a previously published number.
- jobless (unemployment) claims
- Weekly count of new US unemployment benefit claims.
Educational material about reading market data, not investment advice.