Comparing returns (CMP)
CMP draws two or more tickers as percentage returns from the same start date, so you can see which did better over the same window.
- 4 min
- 3 questions
- Lesson 1 of 5
Why you would care
Over the same period, how did these compare? NVDA trades around 240 dollars and AMD around 180. Their prices say nothing about which did better. What matters is how much each moved, from the same day. Comparing returns on a shared start is the most common chart on any desk, and the most commonly done wrong.
The idea from scratch
To compare, rebase every series: set each one to 0% (or 100) on the same start date, then show its percentage change from there.
Three rules make a fair comparison:
- Same start date. If one stock only started trading later, the comparison must start on the first day both exist. Otherwise you compare different periods.
- Same kind of return.
CMPuses closing prices only: no dividends (price return, not total return). A high-dividend stock looks worse than it really did. - Same currency awareness. Each line stays in its own listing's currency; a foreign stock's return in its home currency is not your return in dollars.
The start date changes the story. A stock that crashed in March looks great if you start the chart in April.

See it in Gloom
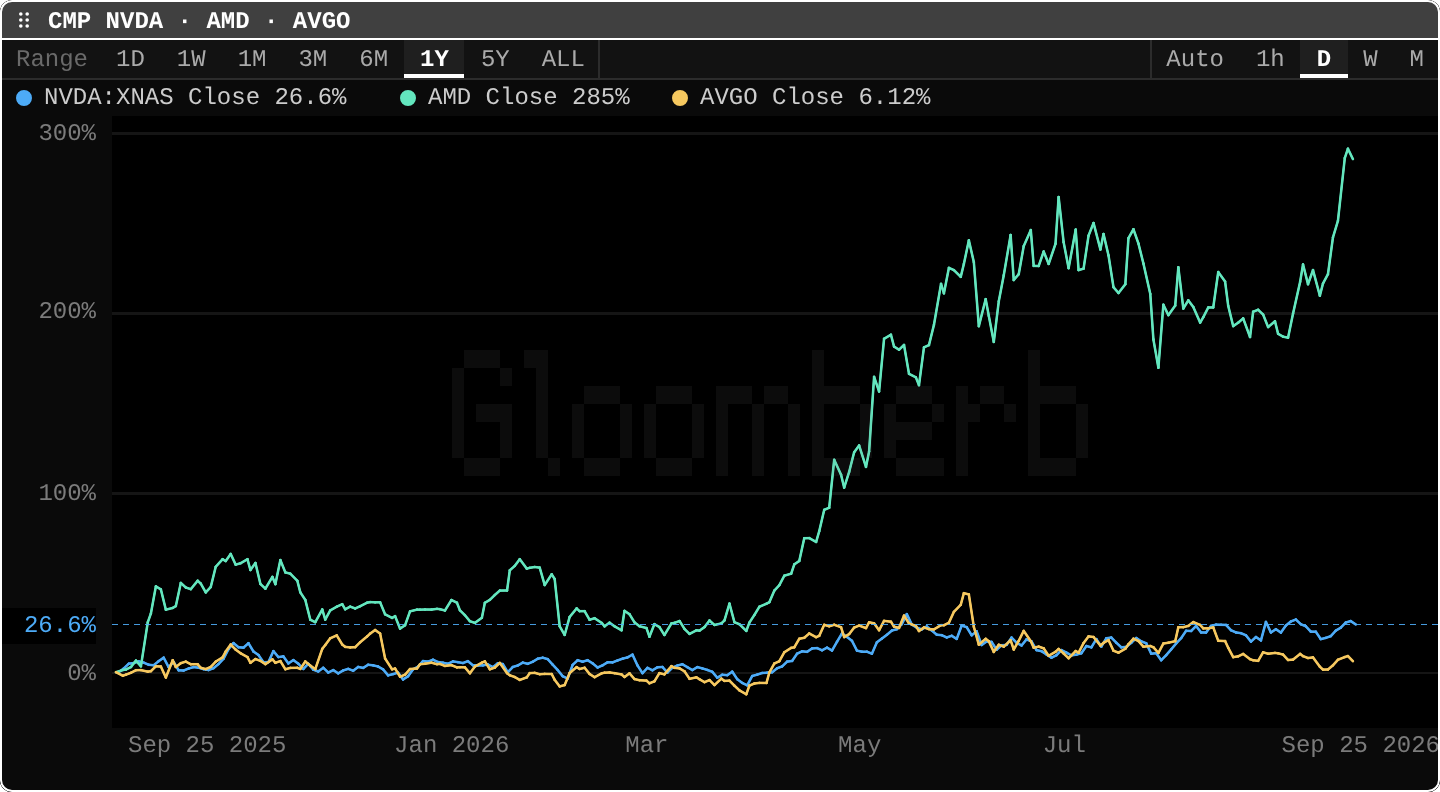
open ittype CMP NVDA, AMD, AVGO. Range on the left (1D to ALL), bar size on the right (Auto, 1h, D, W, M). Chart keys: s series, i indicators, t timeframe, f formulas.
- The legend:
NVDA:XNAS Close 26.6%,AMD Close 285%,AVGO Close 6.12%: the one-year price change of each. - The lines all start at
0%on the left (late September 2025). - AMD (green) stays near the others until April 2026, then climbs to almost +300%.
- The dashed line at
26.6%: NVDA's latest value, labeled on the axis. - Change the range to
5Yand the ranking can change completely.
Practice and recap
Try it3 tasks
- In the screenshot, roughly when did AMD separate from the other two? (April 2026.)
- Stock A: 20 to 25. Stock B: 200 to 240. Which did better? (A: +25% against +20%.)
- Why might a dividend-paying utility look weak on
CMPagainst a tech stock? (CMPleaves out dividends.)
Common mistakes4 mistakes
- Comparing prices instead of returns.
- Cherry-picking the start date.
- Forgetting dividends when comparing income stocks with growth stocks.
- Comparing a stock with an index level: use an ETF that tracks the index (like SPY) to stay in price returns.
Check yourself3 questions
- What does rebasing mean?
- Why must the start date be shared?
- Does
CMPinclude dividends?
Answers
- Restarting several series at the same value (0% or 100) on the same date.
- Otherwise the lines cover different periods and the comparison is unfair.
- No: closing prices only, a price return.
Words in this lesson4 words
- rebase (normalize)
- Restart series at the same value on the same date.
- relative performance
- How one return compares with another over the same window.
- price return
- Return from price changes only, no dividends.
- window
- The period a chart or calculation covers.
Educational material about reading market data, not investment advice.