Realized volatility and the cone (HVG, HVT)
HVG charts realized volatility over windows from 10 to 260 sessions, and HVT (the cone) places each window's current value in its own range over the past year or two.
- 4 min
- 3 questions
- Lesson 2 of 4
Why you would care
Is this stock moving more or less than usual? To call options "cheap" or "expensive" you need a yardstick. The best one is the stock itself: how much it has really moved over different windows, and how unusual that is. The volatility cone is the classic tool for this, used by every options desk.
The idea from scratch
Realized volatility over a window = the standard deviation of daily returns over the last N sessions, annualized (previous lessons). Different windows tell different stories:
- 10 sessions: the last two weeks. Jumpy, reacts to every event.
- 60 to 90 sessions: the last quarter.
- 260 sessions: the whole year.
The cone
For each window length, look back over a year (or two) and record the lowest, highest, average and median value that window's realized vol has taken. Plot min, max and mean for each window side by side: the lines form a cone, wide on the left (short windows swing a lot) and narrower on the right.
Then place today's values in it:
- Near the top: the stock is moving unusually much.
- Near the bottom: unusually calm.
- The percentile says exactly where (0 lowest, 100 highest).

See it in Gloom
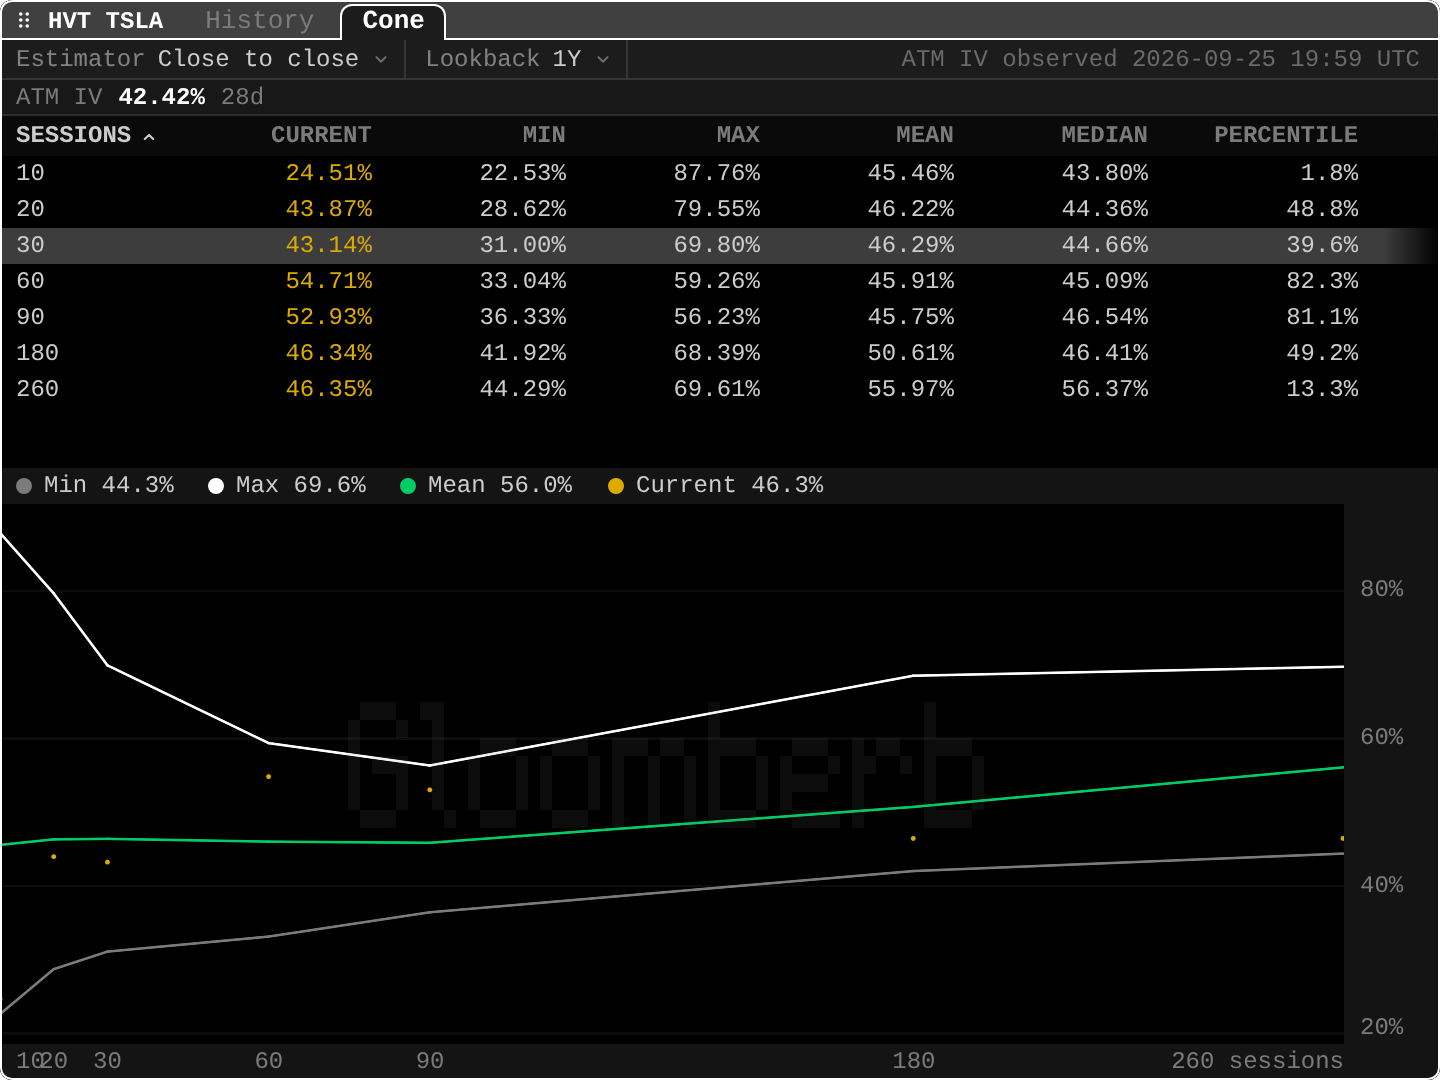
open ittype HVT TSLA for the cone, HVG TSLA for the rolling chart. Keys: v view, i toggles the IV line, s opens the surface. Settings: estimator (close to close) and lookback (1Y, 2Y).
ATM IV 42.42% 28d: today's 28-day at-the-money implied vol, the yardstick to compare with.- Row
10: current 24.51%, at the 1.8th percentile: the last two weeks were unusually calm for Tesla. - Row
60: current 54.71%, 82.3rd percentile: over three months, moves were large. - Row
30: 43.14%, close to the 42.42% implied vol: options price roughly what the stock did last month. - The chart: white max, green mean, grey min; the yellow dots are today's values. Short windows have the widest range (22.5% to 87.8% for 10 sessions).
HVG TSLA draws the same windows as lines over time, with the price and a dated ATM IV reference.
Practice and recap
Try it3 tasks
- Which window is closest to its yearly maximum? (60 sessions, 82.3rd percentile; 90 sessions is close at 81.1.)
- Is 28-day implied vol (42.4%) high or low against the 30-session cone (31% to 69.8%, mean 46.3%)? (Slightly below average.)
- Why are short windows' ranges wider? (A few big days dominate a short window.)
Common mistakes4 mistakes
- Comparing an implied vol for one horizon with a realized window of a very different length.
- Reading a calm 10-day window as "risk is gone": earnings or news can be days away.
- Forgetting that the cone describes the past year only.
- Mixing estimators (close-to-close vs intraday ranges) when comparing with other tools.
Check yourself3 questions
- What does the volatility cone show for each window?
- A window's percentile is 95. What does it mean?
- Why compare realized windows with implied vol?
Answers
- The lowest, highest, average and median realized volatility over the lookback, and today's value.
- Realized vol over that window is higher than in 95% of the past year's observations.
- To judge whether options price more or less movement than the stock has actually shown.
Words in this lesson4 words
- rolling window
- The last N sessions, recomputed every day.
- volatility cone
- Min, mean, median and max realized vol per window length over a lookback.
- percentile (of vol)
- Where today's value ranks in its own history, 0 to 100.
- estimator
- The formula used for realized vol (close to close here).
Educational material about reading market data, not investment advice.