Who holds the futures (COT)
The CFTC's weekly Commitments of Traders shows how many futures contracts speculators, hedgers and small traders hold long and short, and COT shows it per market with history and percentiles.
- 5 min
- 3 questions
- Lesson 3 of 7
Why you would care
Who holds the futures, and is the positioning crowded? When speculators are already very long oil, who is left to buy? Extreme positioning often comes before sharp reversals, and desks watch it every Friday afternoon. COT is one of the few free, official windows into who holds what in futures.
The idea from scratch
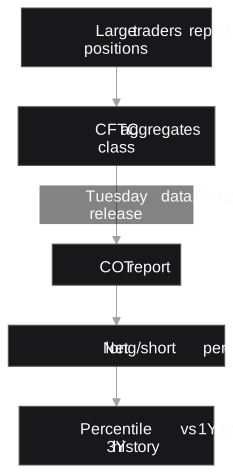
Large traders must report their futures positions daily to the CFTC (the US futures regulator). Each week it publishes aggregates by trader class:
| Class (Legacy report) | Who | Why they trade |
|---|---|---|
| Commercial | Producers, refiners, airlines, farmers, merchants | Hedging a real business |
| Noncommercial | Funds and large speculators | Profit from price moves |
| Nonreportable | Small traders below the reporting size | Mixed |
The Disaggregated report splits further: producers and merchants, swap dealers, managed money (hedge funds and commodity trading advisers), other reportables.
Stock index, rate, currency and VIX futures have a third report, Traders in Financial Futures (TFF), with classes made for financial markets:
| Class (TFF report) | Who |
|---|---|
| Dealer/Intermediary | Banks and dealers, taking the other side of their clients' trades and hedging it |
| Asset Manager/Institutional | Pension funds, insurers, mutual funds: long-run investors |
| Leveraged Funds | Hedge funds and other money managers, often on borrowed money: the speculators most watched |
| Other Reportables | Other large traders, such as proprietary trading firms |
Each report counts futures only, or futures and options combined: options are added as the number of futures they move like.
Net position = longs - shorts. Commercials are usually net short (a producer sells future output); speculators usually take the other side.
Timing: positions are as of Tuesday, published Friday afternoon. By the time you read it, three days of trading have happened.
See it in Gloom
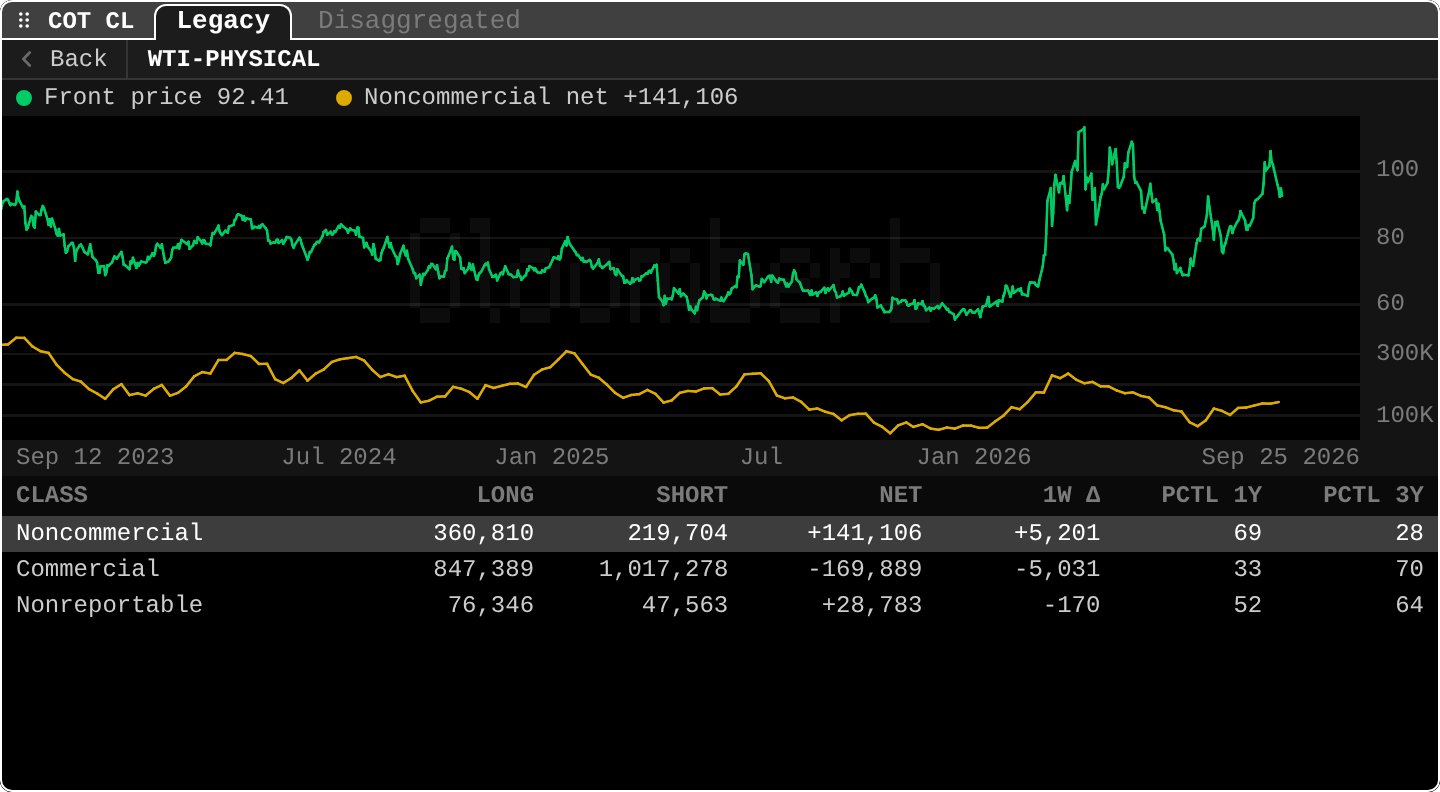
Open ittype COT CL, or COT for the board of all markets (sorted by how unusual their positioning is). Tabs: Legacy, Disaggregated, Financial (TFF); p picks futures only or futures + options. Back returns to the board.
Front price 92.41,Noncommercial net +141,106: speculators are net long about 141,000 contracts.- Row
Noncommercial 360,810 219,704 +141,106 +5,201: their net rose by 5,201 contracts in the latest week. PCTL 1Y 69,PCTL 3Y 28: fairly high for the past year, low for the past three years.- Row
Commercial ... -169,889: hedgers are net short, as usual. - The chart: the speculative net (yellow) fell through 2025 while prices fell, then rose with prices in 2026.
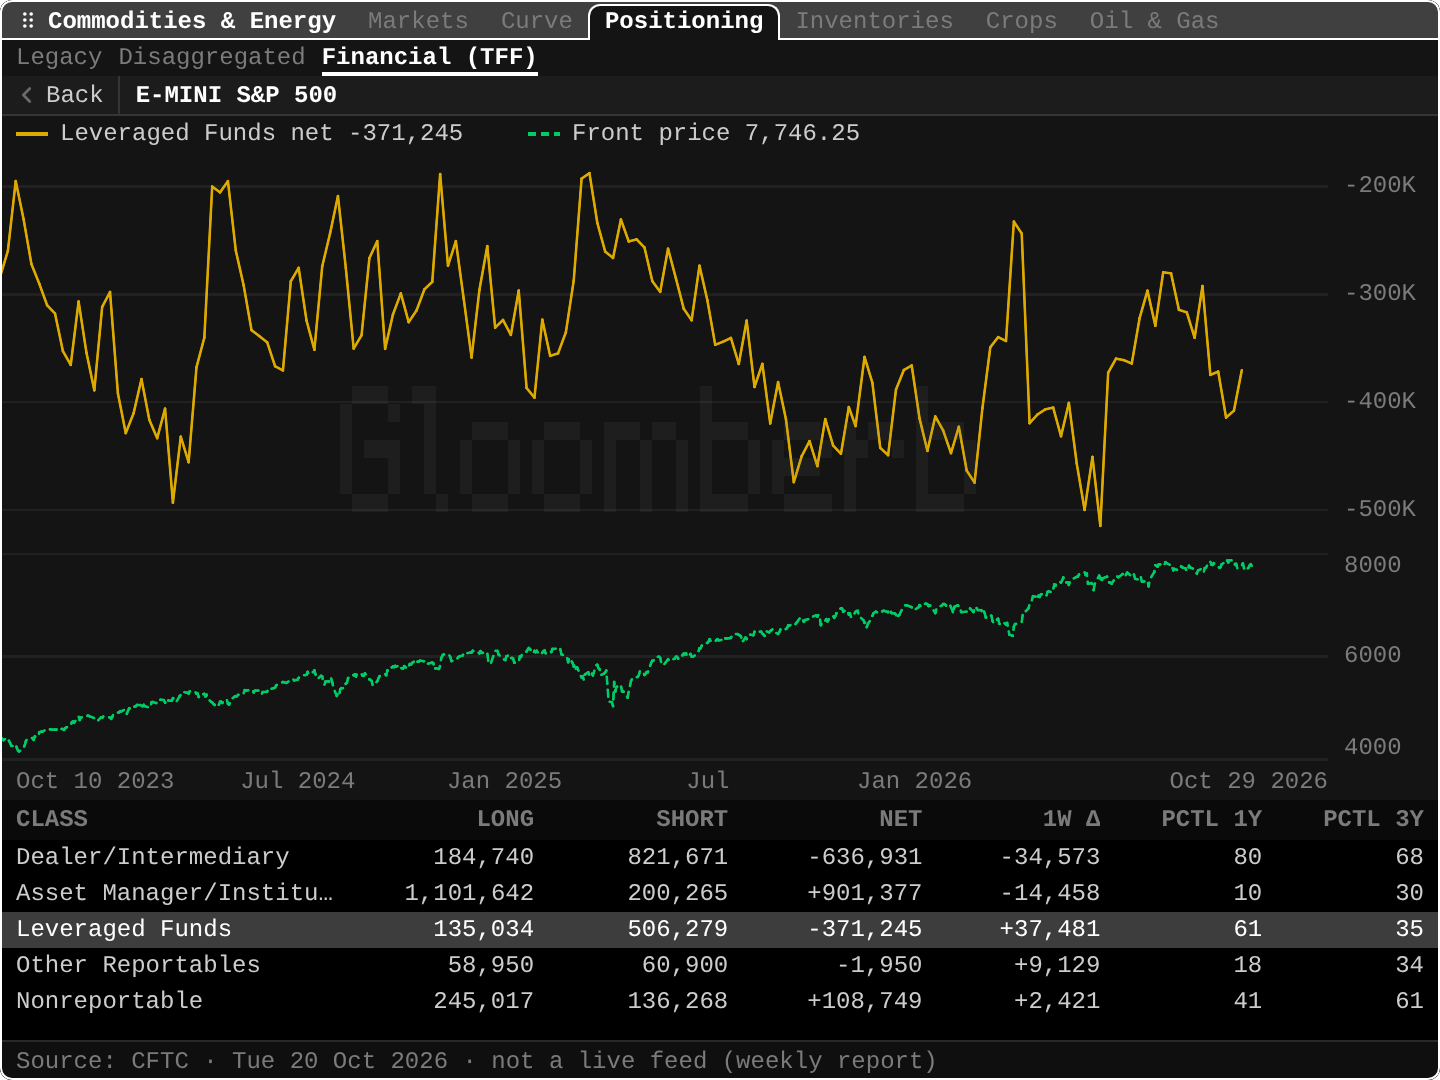
Leveraged Funds 135,034 506,279 -371,245 +37,481: hedge funds are net short about 371,000 E-mini contracts, 37,481 less short than a week before.Asset Manager/Institutional ... +901,377: long-run investors hold the other side, net long.
Practice and recap
Try it3 tasks
- Which class is net short in the screenshot? (Commercial.)
- Why are commercials usually net short in oil? (Producers hedge future output by selling futures.)
- Speculators' net long is at the 98th percentile of 3 years. What risk does that suggest? (Crowding: few buyers left; a reversal could be sharp.)
Common mistakes4 mistakes
- Treating COT as real-time. It is three days old at release.
- Reading commercial positions as a price forecast: they hedge, they do not bet.
- Comparing net positions across markets of different sizes; use percentiles.
- Comparing a futures-only figure with a futures + options one.
Check yourself3 questions
- Who publishes the Commitments of Traders?
- As of which day are positions measured, and when are they released?
- What is a net position?
Answers
- The CFTC, the US futures regulator.
- Tuesday; released on Friday.
- Longs minus shorts for a trader class.
Words in this lesson9 words
- CFTC
- The US regulator of futures and swaps.
- Commitments of Traders (COT)
- The weekly report of futures positions by trader class.
- commercial / noncommercial
- Hedgers with a real business / speculators.
- managed money
- Hedge funds and commodity trading advisers (Disaggregated report).
- Traders in Financial Futures (TFF)
- The COT report for stock index, rate, currency and VIX futures.
- leveraged funds
- Hedge funds and other money managers in the TFF report.
- futures and options combined
- A COT count that adds options as the futures they move like.
- net position
- Longs minus shorts.
- crowded positioning
- A net position at an extreme of its own history.
Educational material about reading market data, not investment advice.