Short interest and squeezes (SI, SIV, SIW)
SI shows short interest over time with days to cover, SIV the daily short share of off-exchange volume (a noisier number), and SIW ranks your names by how crowded the short is.
- 5 min
- 3 questions
- Lesson 4 of 4
Why you would care
How many traders are betting against this stock, and could they be squeezed? When many traders are short and the price rises, they lose money and may have to buy shares to close their bets. Their buying pushes the price higher, forcing more buying: a short squeeze. Short interest is also a plain sentiment gauge: lots of shorts means many professionals think the stock is overpriced.
The idea from scratch
Selling short means borrowing shares, selling them, and hoping to buy them back cheaper later (chapter 01, Orders, long, short and margin). Until the shares are bought back, the position is open.
Short interest = all open short positions in a stock, in shares. In the US, brokers report it to FINRA (the brokers' regulator) for settlement dates twice a month; it is published about two weeks later.
Two ways to size it:
Short % of float
short interest / float (the shares available to trade, excluding those held by insiders and other locked-up holders). 20% of float is very high; 1% is low.
Days to cover
short interest / average daily volume. How many days of normal trading it would take for all shorts to buy back.
Daily short volume is not short interest
Every day, FINRA also publishes how much of the off-exchange volume was marked as short sales. Market makers sell short all day to supply buyers, so this number is often 40% to 50% and says little alone. Compare it with its own history, never read it as "half the market is bearish".

See it in Gloom
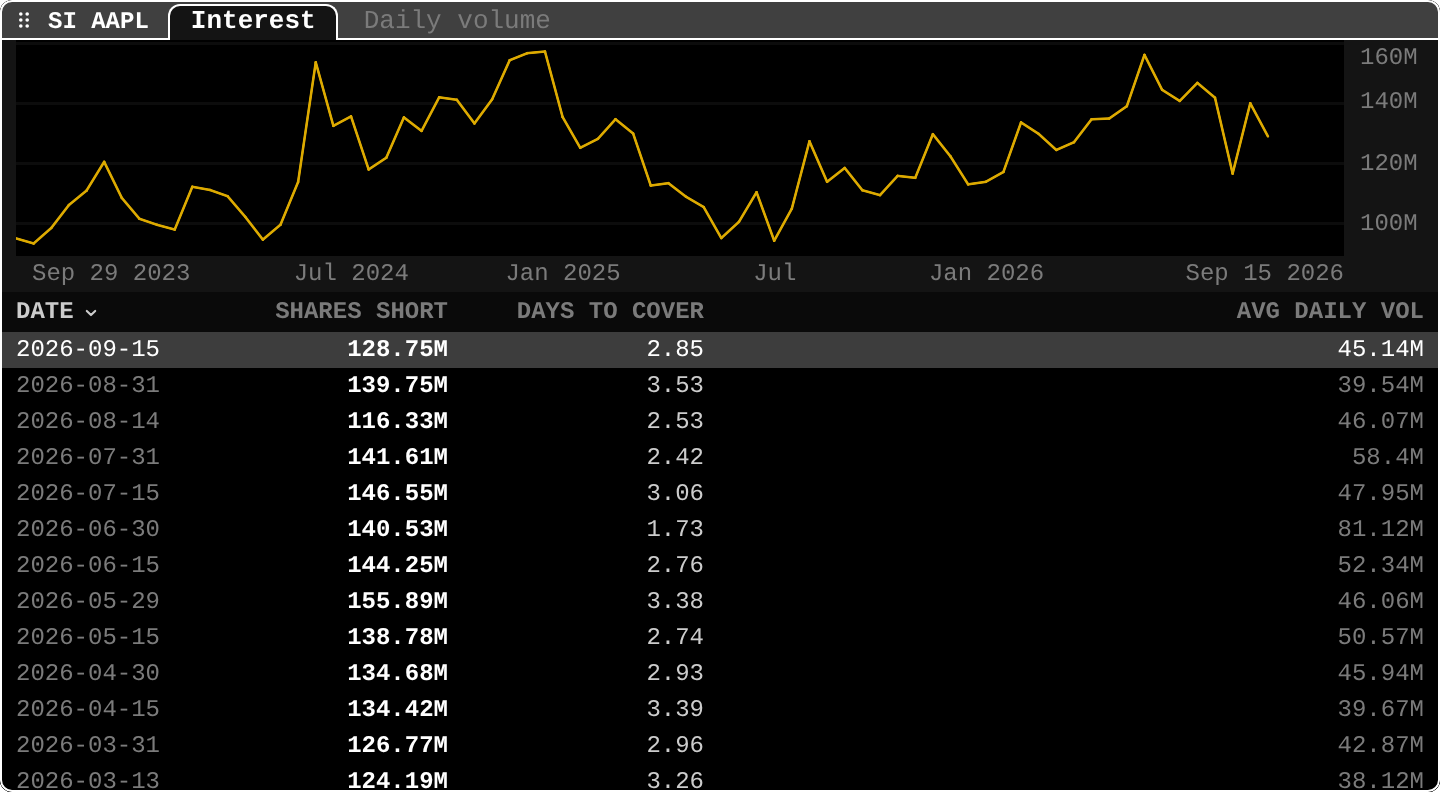
open ittype SI AAPL. Tabs: Interest and Daily volume. v switches the view.
2026-09-15 128.75M 2.85 45.14M: on the September 15 settlement, 128.75 million AAPL shares were short. With 45.14 million shares traded per day, that is 2.85 days to cover (128.75 / 45.14).- The chart: short interest ranged from about 95 to 160 million shares over three years.
- For Apple, 128 million shares is under 1% of the float: a lot of shares, but not a crowded short.
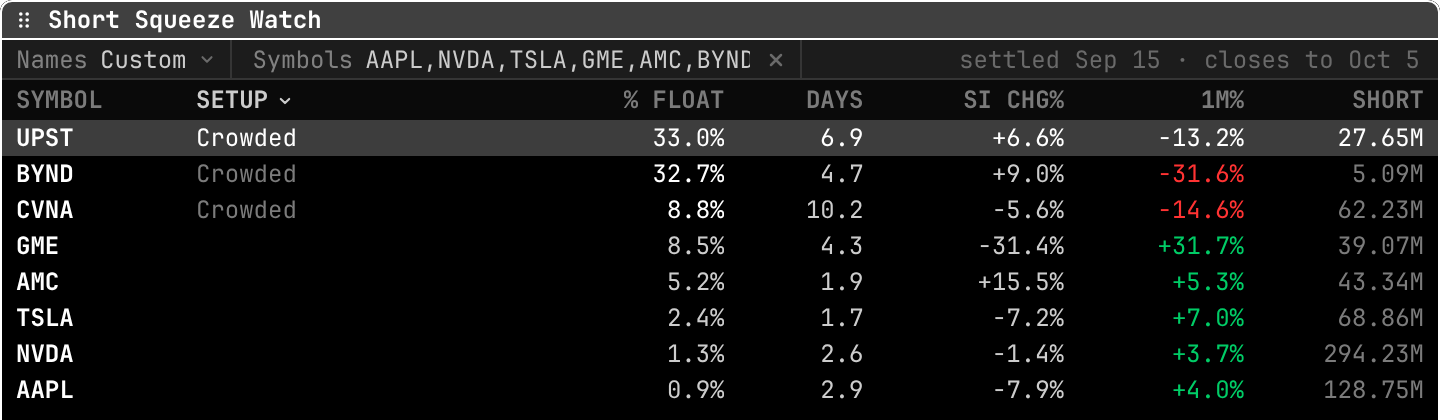
SIW (with no tickers it uses your portfolios and watchlists):
UPST Crowded 33.0% 6.9: a third of the float is short, almost 7 days to cover.SI CHG%and1M%: shorts added 6.6% while the price fell 13.2%: the shorts are winning for now. A squeeze setup needs a rising price against a crowded short.settled Sep 15 · closes to Oct 5: the short data's date, and the latest prices used.
SIV TSLA shows the daily off-exchange short share of volume against its one-year range.
Practice and recap
Try it3 tasks
- In SIW, which name has the most days to cover? (CVNA, 10.2.)
- GME: shorts down 31.4%, price up 31.7% over the month. What happened? (Shorts bought back as the price rose: a squeeze-like move.)
- 50 million shares short, 5 million average daily volume. Days to cover? (10.)
Common mistakes4 mistakes
- Treating daily short volume as short interest.
- Reading high short interest as a buy signal. Shorts are often right.
- Ignoring the date: short interest is two to four weeks old when you see it.
- Comparing short shares across companies of different sizes. Use % of float.
Check yourself3 questions
- What is the float?
- Define days to cover.
- What two conditions together make a squeeze possible?
Answers
- The shares available for public trading, excluding those held by insiders and other locked-up holders.
- Short interest divided by average daily volume.
- A crowded short (high % of float or days to cover) and a rising price.
Words in this lesson7 words
- short interest
- Shares sold short and not yet bought back.
- float
- Shares available for public trading.
- short % of float
- Short interest divided by float.
- days to cover
- Short interest divided by average daily volume.
- short squeeze
- Rising prices forcing shorts to buy, pushing prices higher.
- settlement date (short interest)
- The date the short positions are counted, twice a month.
- daily short volume
- The short-marked share of a day's off-exchange volume; not short interest.
Educational material about reading market data, not investment advice.