Screening the market (EQS)
EQS keeps only the stocks in its stored universe that meet all your rules (valuation, growth, margins, liquidity, ownership and more) and ranks the matches.
- 4 min
- 3 questions
- Lesson 5 of 5
Why you would care
Which companies fit what you are looking for? There are thousands of listed companies. Nobody reads them all. A screen turns "cheap, growing, not too indebted" into a short list you can study one by one. It is the first step of many investment processes, and the place where a sloppy rule wastes hours.
The idea from scratch
A screen is a set of criteria (rules). Each criterion is a field, a comparison and a value:
P/E between 0 and 25Revenue growth ≥ 10%Market cap ≥ 10B
All criteria must be true at the same time (they are joined with AND). Then you rank the survivors by one metric, for example cheapest first.
What a screen cannot do
- It only sees numbers it has. A company with a missing value cannot pass a rule on that value.
- It sees the covered universe: the listings in its stored daily snapshot, not every stock in the world.
- It does not know why a number is odd: a low P/E may come from a one-off gain (chapter 04).
The percentile column
Next to the chosen metric, a percentile ranks each company within the whole covered universe: 99 means higher than 99% of covered companies.
- Covered universe: daily snapshot
- Criterion 1
- Criterion 2
- Criterion 3
- Matches ranked by your metric
- Open each one and read
See it in Gloom
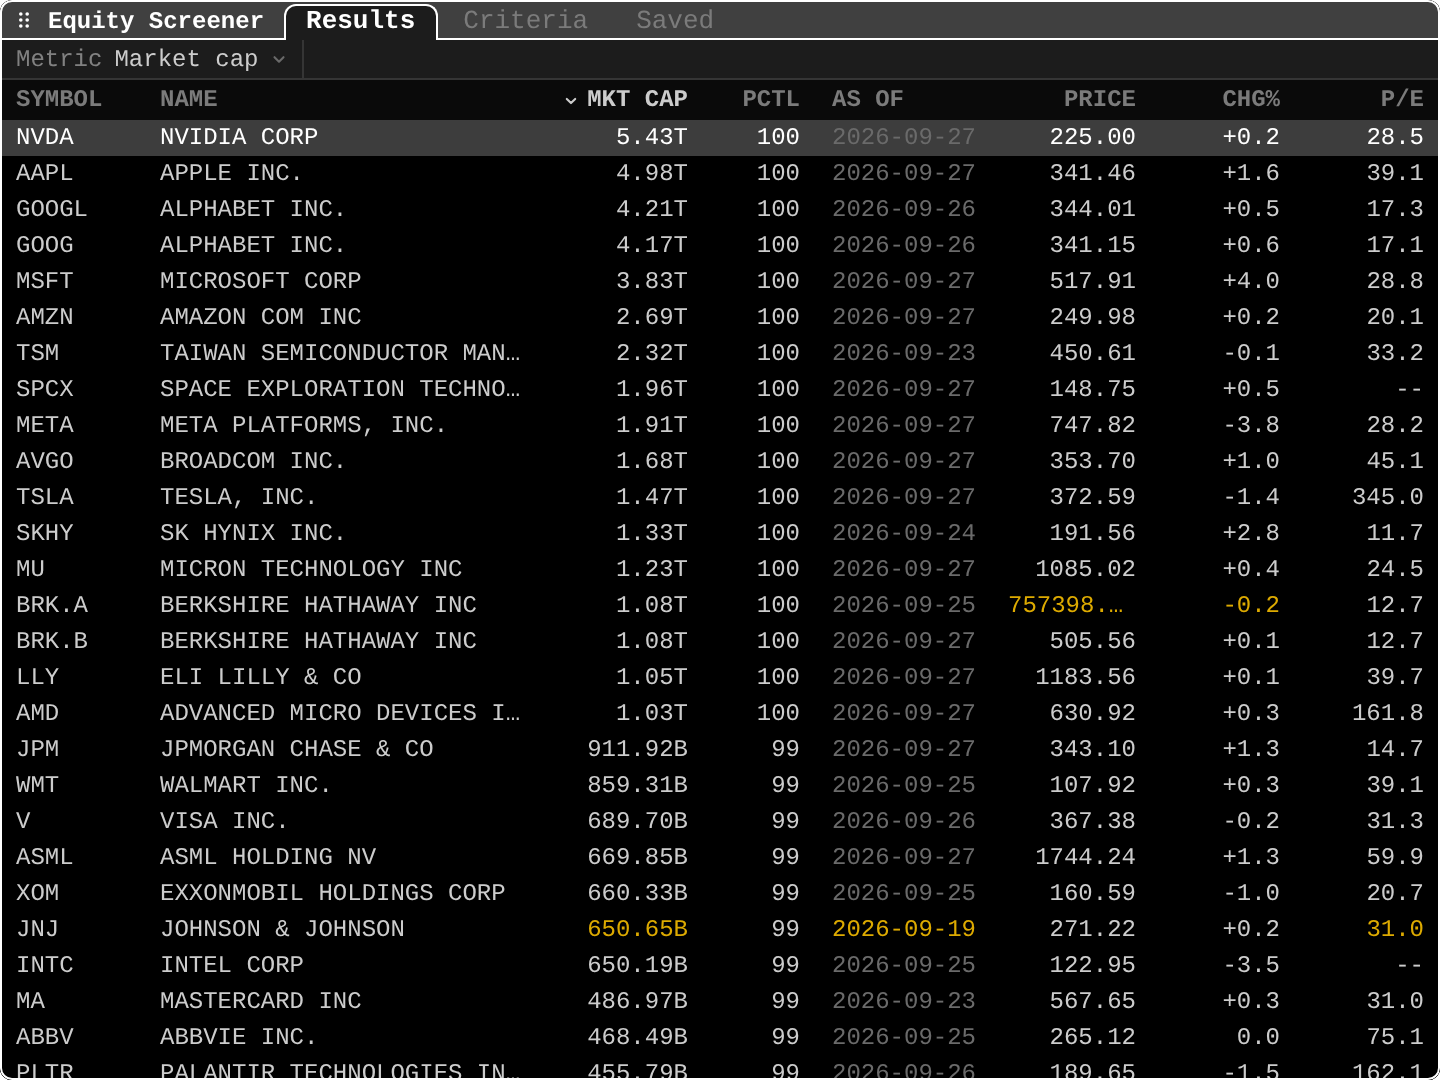
open ittype EQS. Tabs: Results, Criteria, Saved. Keys: a add a criterion, m change the metric, s save the screen, o open a company, x export all matches.
Metric Market cap: the ranking column, here biggest first.PCTL 100: these companies are in the top percentile of the covered universe by market cap.AS OF: the date of the value. Values shown in amber are stale (older than usual), like JNJ's 2026-09-19 row.PRICE,CHG%,P/E: context columns.--means not available (no P/E when earnings are negative or missing).- Duplicates are real:
GOOGLandGOOGare two share classes of Alphabet;BRK.AandBRK.Bof Berkshire Hathaway.
Fields you can screen on include valuation (P/E, P/B, EV/EBITDA), growth, margins, ROE, returns (1W to 1Y), distance from the 52-week high, beta, estimate revisions, analyst upside, short interest, insider and 13F activity, implied volatility rank, and social attention. Thresholds accept k, M, B, T (10B = ten billion).
Practice and recap
Try it3 tasks
- In the screenshot, which company has the highest P/E in the visible rows? (TSLA, 345.0.)
- Write three criteria for "large, cheap, growing". (Market cap ≥ 10B; P/E between 0 and 20; revenue growth ≥ 10%.)
- Why put "P/E between 0 and 25" rather than "P/E below 25"? (To exclude negative P/Es from companies with losses.)
Common mistakes4 mistakes
- Treating the match list as a buy list. It is a reading list.
- Forgetting missing data: a company without a value is silently excluded.
- Screening on one period's number that includes a one-off.
- Duplicating share classes and thinking you found two companies.
Check yourself3 questions
- How are several criteria combined?
- What does a percentile of 95 mean in the results?
- Why can a great company be missing from your results?
Answers
- With AND: a company must pass all of them.
- Its value is higher than 95% of the covered universe for that metric.
- It may lack a value for one criterion, be outside the covered universe, or fail a rule because of an odd period.
Words in this lesson6 words
- screen
- A filter that keeps only stocks meeting your criteria.
- criterion
- One rule: a field, a comparison and a value.
- metric (ranking)
- The column used to order the matches.
- covered universe
- The set of listings the screener has data for.
- share class
- One of several kinds of shares of the same company (GOOGL and GOOG).
- stale value
- A number older than it should be.
Educational material about reading market data, not investment advice.