The intraday chart (GIP)
GIP charts one trading session (or the last five) minute by minute, with volume below and the session's start and end marked.
- 4 min
- 3 questions
- Lesson 2 of 5
Why you would care
What happened today, and when? A stock closes down 0.3%. Boring? Maybe not. It might have jumped 2% at noon and given it all back, or crashed at the open and clawed back all afternoon. The daily candle hides all of that. The intraday chart shows it.
The idea from scratch
Intraday means "within one day". An intraday chart uses small bars: one minute, five minutes, an hour. Each bar is still a candle (open, high, low, close for that minute), just a very short one.
A session is one stretch of trading. For the big US exchanges the regular session runs 9:30 am to 4:00 pm New York time. Trading before it is premarket, after it after-hours. Fewer people trade outside the regular session, so prices there can jump around on small volume.
How many bars is that? 6.5 hours times 60 minutes = 390 one-minute bars in a regular US session. When we asked Gloom for a TSLA session, it returned exactly 390 price points.
Volume has a daily shape too. The first minutes and the last minutes are usually the busiest: people react to overnight news at the open, and many funds trade at the close. The middle of the day is often quiet.
- Premarket: thin
- 9:30 open: busy
- Midday: often quiet
- 4:00 close: busy
- After-hours: thin
See it in Gloom
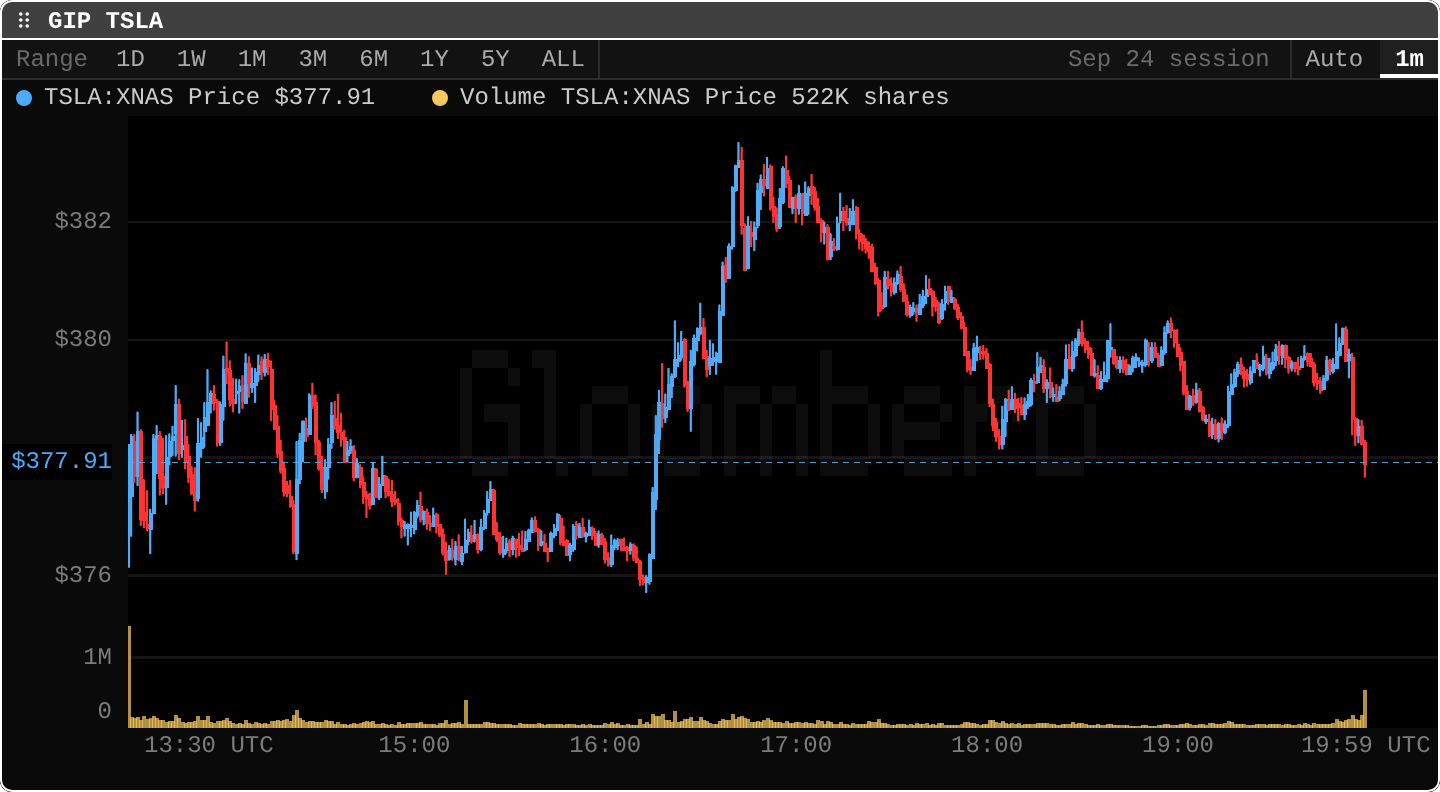
open ittype GIP TSLA.
The tour:
- Session label, top right:
Sep 24 session. The chart shows one session, not "the last 24 hours". - Interval:
1mis selected, one candle per minute.Autouses one-minute bars for one session and five-minute bars for five sessions. - The time axis runs from
13:30 UTCto19:59 UTC. New York was 4 hours behind UTC that day, so that is 9:30 am to 3:59 pm: the regular session, minute by minute. - The price story. A slow slide from about $380 to $376 by 16:00 UTC (noon in New York), a sudden jump to about $383, then a drift back down to $377.91 at the close.
- The dotted line at $377.91: the last price.
- Volume at the bottom. Look at the tall bar at the very start and the tall bar at the very end. Busy open, busy close, quiet middle.
On desktop, bars outside the regular session sit on a tinted band; the terminal version marks where the regular session starts and ends with a dotted rule. Intraday history for US listings currently covers the regular session, so the band shows up mostly on other markets.
Keys are the same as every chart: s series, i indicators, t timeframe, f formulas.
Practice and recap
Try it3 tasks
- In the screenshot, find the minute where the price jumped. Convert its UTC time to New York time.
- Was the jump on heavy volume? Look straight down from it to the volume bars.
- Compare the session's high (about $383) with its low (about $375.5). What is that range as a percent of $378? (About 2%.)
Common mistakes4 mistakes
- Reading UTC times as local times. 13:30 UTC is not "1:30 pm in New York".
- Expecting a big move on a quiet volume bar to mean much. Few shares can push a price for a minute.
- Forgetting the daily candle and the intraday chart describe the same day. A small daily change can hide a wild session.
- Comparing one-minute charts across days without noticing that one was a half-day session.
Check yourself3 questions
- How many one-minute bars does a full regular US session have?
- If a chart starts at 14:30 UTC in January, what New York time is that?
- Why is volume often highest at the open and the close?
Answers
- 390 (6.5 hours times 60).
- 9:30 am. In winter New York is 5 hours behind UTC.
- The open absorbs overnight news; the close is when many funds trade.
Words in this lesson6 words
- intraday
- within one trading day
- session
- one stretch of trading on an exchange
- regular session
- the main US trading hours, 9:30 am to 4:00 pm New York time
- premarket / after-hours
- trading before / after the regular session, usually thin
- one-minute bar
- a candle covering one minute
- UTC
- the world reference clock that Gloom charts use
Educational material about reading market data, not investment advice.