Revenue by segment and company KPIs (SEG, KPIS)
SEG splits a company's revenue by product, segment and region from its filings, and KPIS tracks the operating numbers it reports beyond the statements, each with its source quote.
- 5 min
- 3 questions
- Lesson 4 of 5
Why you would care
Which part of the business is driving the numbers? "Apple grew 8%." Was it iPhones, or services, or China? The total hides the engine. Analysts build their forecasts line by line: one growth rate per product, per region.
SEGandKPISgive you those lines.
The idea from scratch
Segments
A segment is a part of a company that management runs and reports separately: a product line, a business unit or a region. US companies must report revenue (and often profit) by reportable segment in their quarterly (10-Q) and annual (10-K) filings. Many also split revenue by product and by geography.
The mix (each part's share of the total) changes over time, and with it the company's margins and risks.
KPIs
A KPI (key performance indicator) is an operating number management reports because it explains the business: subscribers for a streaming company, monthly active users for an app, units delivered for a carmaker, same-store sales for a retailer, annual recurring revenue (ARR) for a software company.
KPIs are not in the three statements. They live in press releases, filings and earnings calls, each company with its own definitions. That makes them powerful, and easy to misread.

See it in Gloom
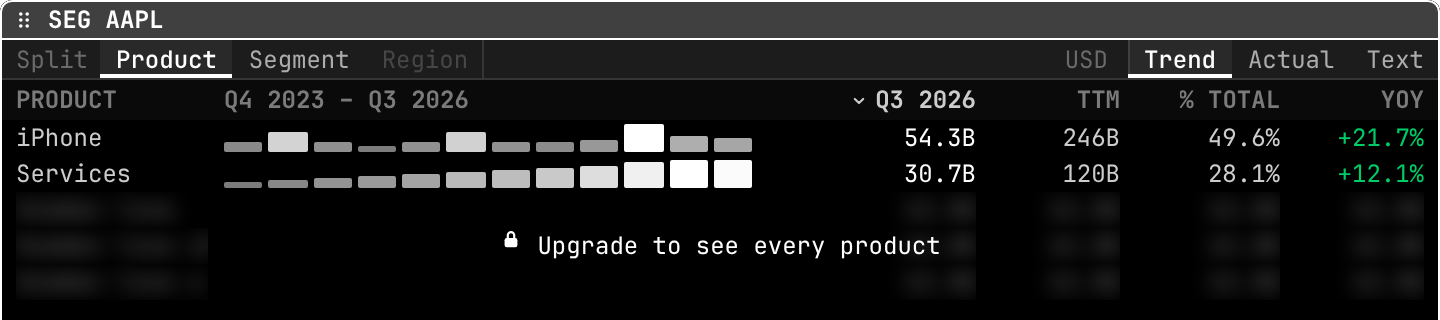
open ittype SEG AAPL. Choose Product, Segment or Region (and Split) on the left; Trend, Actual or Text on the right.
iPhone 54.3Bin Q3 2026: iPhone revenue that quarter.TTM 246B: the last four quarters.% TOTAL 49.6%: about half of Apple's revenue.YOY +21.7%: up 21.7% on the same quarter a year earlier.Services 30.7B,28.1%,+12.1%: the second engine, growing more slowly that quarter.- The bars:
Trendscales each row to its own range, so you compare shapes;Actualputs every row on one scale, so you compare sizes. Upgrade to see every product: the free plan shows the two largest rows; Pro shows all.
KPIS AAPL opens the KPI table: metric, fiscal period, value with its unit, change against the prior disclosure, and scope (for example "geography" or "product"). Its Chart tab draws one metric over time; its Evidence tab shows the exact sentence and document each number came from. Enter or e opens a row's evidence, o the original source.
Practice and recap
Try it3 tasks
- In the screenshot, what share of Apple's revenue came from iPhone and Services together? (49.6% + 28.1% = 77.7%.)
- Which grew faster on a year earlier in Q3 2026? (iPhone, +21.7% against +12.1%.)
- Name one KPI you would want for a streaming company and one for a carmaker. (Paid subscribers; vehicles delivered.)
Common mistakes4 mistakes
- Adding subtotals and parts: "Products" and "iPhone" overlap. SEG leaves subtotals out.
- Comparing KPIs across companies with different definitions ("active user" means different things).
- Comparing a quarter with the previous quarter in a seasonal business. Use year over year.
- Forgetting that segment definitions change; a renamed segment can break a trend.
Check yourself3 questions
- What is a reportable segment?
- What is the difference between Trend and Actual in SEG?
- Where do KPIs come from, if not the statements?
Answers
- A part of the company that management runs and reports separately in its filings.
- Trend scales each row to its own range (compare shapes); Actual uses one scale for all rows (compare sizes).
- Press releases, filings and earnings calls, with company-specific definitions.
Words in this lesson6 words
- segment
- A part of a company reported separately.
- mix
- Each part's share of the total.
- KPI
- Key performance indicator: an operating number that explains the business.
- ARR
- Annual recurring revenue: yearly value of subscriptions.
- same-store sales
- Sales growth in shops open at least a year, excluding new shops.
- scope
- Which part of the company a number covers (a product, a region).
Educational material about reading market data, not investment advice.