Political polls (POLL)
POLL lists US political polls by type with date, subject, pollster, sample and result, and opens each one with its margin of error and the running average.
- 3 min
- 3 questions
- Lesson 4 of 4
Why you would care
What do voters say, and how much should you trust one poll? Elections and approval ratings move policy expectations: taxes, regulation, trade, defense spending. Markets price those expectations, and prediction markets (previous lesson) trade them directly. A single poll is noisy; the skill is reading averages and knowing which polls to weigh.
The idea from scratch
A poll asks a sample of people a question and generalizes to the whole population.
What to read:
- Sample type
- Who was asked: all adults, registered voters (Reg), or likely voters (Likely, the closest to an election result)
- Sample size
- How many people answered; bigger is more precise
- Margin of error
- The range the true value probably lies in (often about ±3 points for 1,000 people)
- Pollster
- Who ran it; methods and track records differ
Polling averages combine many polls to reduce noise; a weighted average gives more weight to recent, larger or better-rated polls.
- Question to a sample
- Result with margin of error
- Average of many polls
- Trend over time
- Market and policy expectations
See it in Gloom
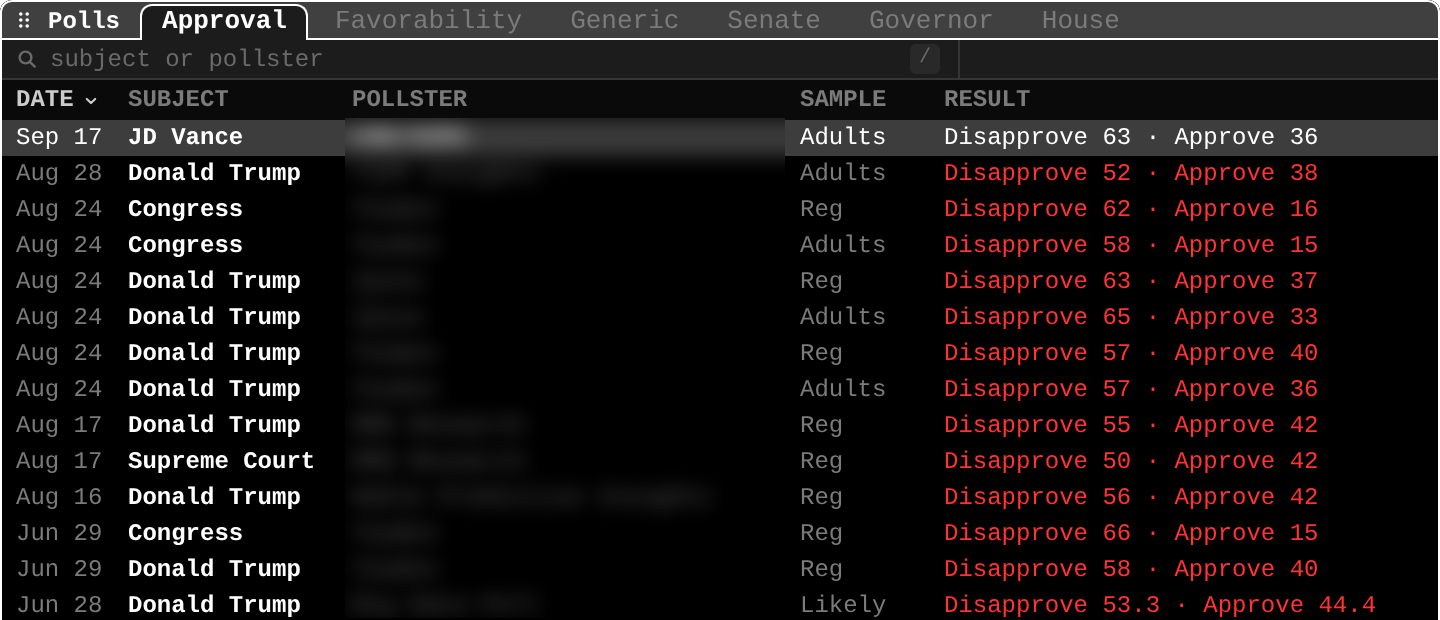
open ittype POLL. Tabs: Approval, Favorability, Generic, Senate, Governor, House. / searches subjects and pollsters; Enter opens a poll with its sample, margin of error, the weighted average and a trend chart; o opens the source. POLL is an official plugin: typing it offers to install it.
Sep 17 JD Vance ... Adults Disapprove 63 · Approve 36: the newest poll.SAMPLE:Adults,Reg(registered voters),Likely(likely voters).RESULT: the two main answers; red when the leading answer is negative for the subject.- Several polls on the same day (
Aug 24) with different samples give different numbers: same question, different populations. - Decimals (
53.3 · 44.4): pollsters that publish weighted figures.
Practice and recap
Try it3 tasks
- Two polls on Aug 24 for the same subject: adults 65/33, registered 63/37. Why might they differ? (Different populations, plus normal sampling noise.)
- Approve 40 with a ±4 margin: plausible range? (36 to 44.)
- Why do likely-voter polls matter most before an election? (They best match who will actually vote.)
Common mistakes4 mistakes
- Treating a one-poll move inside the margin of error as a change.
- Comparing polls of different populations.
- Ignoring the pollster's method and track record.
- Treating polls as forecasts of the outcome on the day.
Check yourself3 questions
- What is the margin of error?
- What is the difference between "Reg" and "Likely"?
- Why use a polling average?
Answers
- The range within which the true value probably lies, given the sample size.
- Registered voters vs voters screened as likely to vote.
- To reduce the noise of any single poll.
Words in this lesson6 words
- poll
- A survey of a sample, generalized to a population.
- sample
- The people actually asked.
- margin of error
- The likely range around a poll's result.
- registered / likely voters
- People registered to vote / screened as likely to vote.
- polling average
- A combination of many polls.
- generic ballot
- A poll asking which party people would vote for, without candidates.
Educational material about reading market data, not investment advice.