How stocks move together (GR, CORR)
GR studies how two tickers move together (ratio, rolling correlation, regression) and CORR builds a correlation matrix for a whole basket.
- 4 min
- 3 questions
- Lesson 4 of 5
Why you would care
Do these really move together, and how much? You own five chip stocks and feel diversified. If they all move together, you really own one big bet. Pairs traders, risk managers and portfolio builders all start with the same question: how related are these prices?
The idea from scratch
Correlation, again
Correlation measures how two return series move together, from -1 to +1 (chapter 01, Understanding risk):
- +1: always move the same way, in proportion.
- 0: no linear relationship.
- -1: always opposite.
It is computed on returns (daily or weekly changes), never on price levels: two prices that both rise for years look related even when their day-to-day moves are not.
Rolling correlation recomputes it over a moving window (say the last 60 observations), so you see the relationship change over time.
Regression: beta, alpha, R²
A regression fits the best straight line through a cloud of points: here, each point is one period, with one stock's return on one axis and the other's on the other axis.
Beta
the slope. Beta 0.5 means: when the second stock moves 1%, the first moves 0.5% on average.
Alpha
the average return left over that the other stock does not explain.
R² (R-squared)
the share of one stock's ups and downs explained by the other, from 0 to 1. R² 0.37 means 37% explained, 63% its own story. R² is the correlation squared.
The ratio
Dividing one price by the other gives the ratio line. A rising ratio means the first stock is beating the second. Pairs traders watch it for unusual gaps.

See it in Gloom
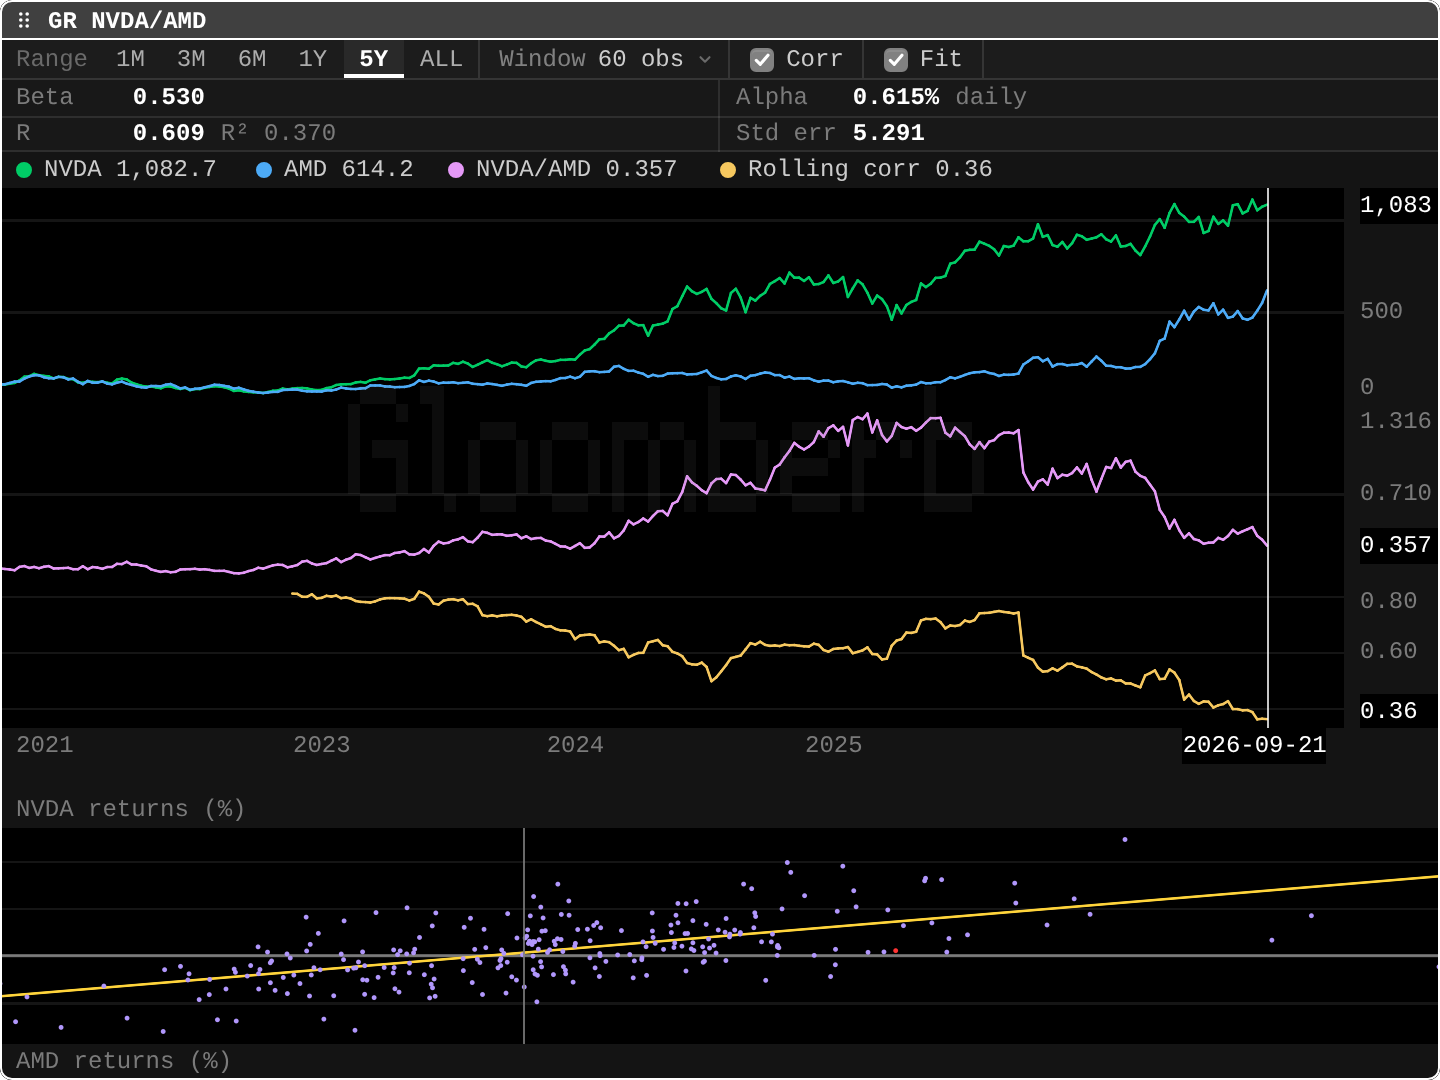
open ittype GR NVDA, AMD. t changes the range; Window sets the rolling window; Corr and Fit toggle the correlation line and the regression.
- Top numbers:
Beta 0.530,R 0.609,R² 0.370,Alpha 0.615%,Std err 5.291. R is the correlation; R² its square. - Green and blue lines: NVDA and AMD indexed to the same start. NVDA ends far higher.
- Pink line: the
NVDA/AMDratio, now 0.357, falling since 2025 as AMD caught up. - Yellow line: the rolling correlation, drifting down from about 0.8 to 0.36: the two stocks move together much less than before.
- Bottom: the scatter of returns with the yellow fitted line. A wide cloud around the line means a loose relationship.
CORR NVDA, AMD, AVGO, TSM shows a matrix: one cell per pair, 1.00 on the diagonal (each stock with itself). Read a row to see which names move with which.
Practice and recap
Try it3 tasks
- From the screenshot, what share of NVDA's moves does AMD explain? (R² 0.37: about 37%.)
- Correlation 0.9 between two stocks. R²? (0.81.)
- Why does the rolling correlation matter more than one number? (Relationships change: these two were tightly linked, now much less.)
Common mistakes4 mistakes
- Computing correlation on prices instead of returns.
- Reading correlation as causation.
- Trusting a correlation measured in calm times to hold in a crash (correlations often jump toward 1 in sell-offs).
- Confusing beta to the market (chapter 1) with beta to another stock (here).
Check yourself3 questions
- What does beta 1.5 to a second stock mean?
- What is R²?
- What does a falling ratio line tell you?
Answers
- When the second stock moves 1%, the first moves about 1.5% on average.
- The share of one series' variation explained by the other, from 0 to 1.
- The second stock is beating the first.
Words in this lesson8 words
- correlation
- How two return series move together, -1 to +1.
- rolling correlation
- Correlation recomputed over a moving window.
- regression
- Fitting a best straight line through points.
- beta (to a stock)
- The slope: one stock's average move per 1% move of the other.
- alpha
- The average return the other series does not explain.
- R²
- The share of variation explained, 0 to 1.
- ratio line
- One price divided by another over time.
- correlation matrix
- A table of correlations for every pair in a basket.
Educational material about reading market data, not investment advice.