Valuation over time (GE, GF, PEB)
PEB, GE and GF turn valuation snapshots into history: a stock's price against fixed P/E lines, multiples over time for several tickers, and statement lines across companies.
- 4 min
- 3 questions
- Lesson 3 of 5
Why you would care
Is this multiple high for this company, compared with its own past? Apple at 38 times earnings. High? For Apple, compared with its own last ten years, it is near the top. For a young software company, 38 might be low. Comparing a stock with its own history is the second half of valuation, after comparing it with peers (previous lesson).
The idea from scratch
Price = multiple x earnings
Every price can be split in two: price = P/E x EPS. A stock rises because earnings grew, or because investors pay a higher multiple, or both.
A P/E band
Draw lines at fixed multiples of trailing EPS (say 20x, 30x, 40x) and plot the price between them. When the price touches the 40x line, the stock trades at 40 times earnings. The lines step up each time a new EPS figure is published.
Percentile
Where today's P/E ranks in its own history: the percentile is the share of past weeks with a P/E at or below today's. 89th percentile = more expensive than in 89% of past weeks.

See it in Gloom
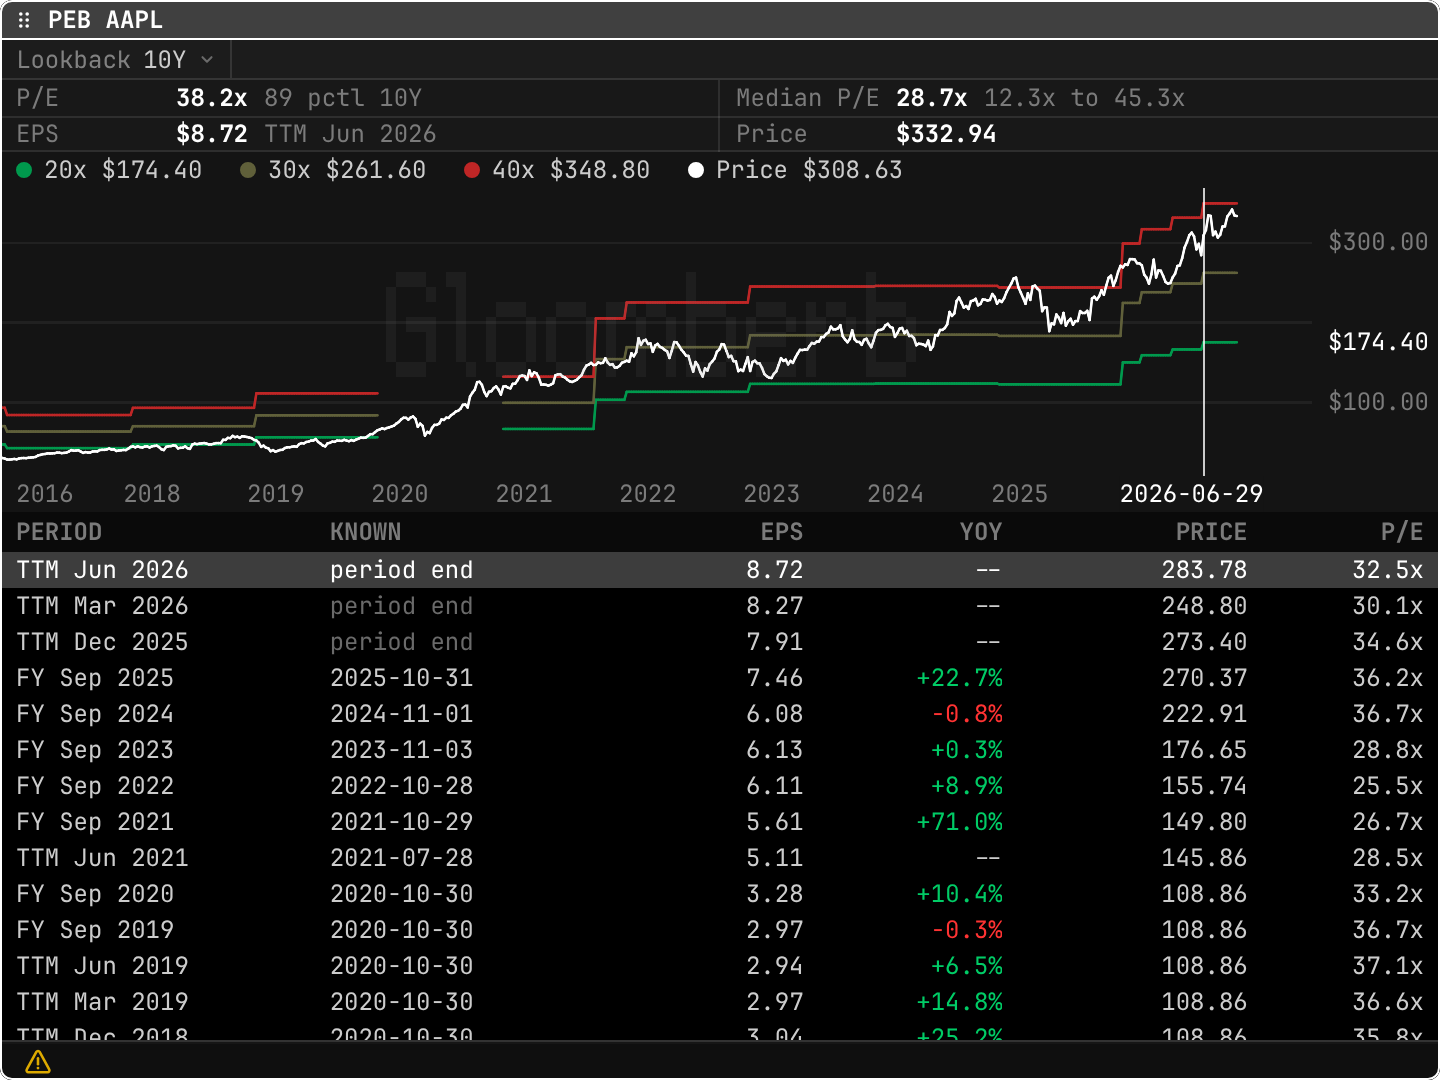
open ittype PEB AAPL. Change Lookback (5Y, 10Y, all).
P/E 38.2x 89 pctl 10Y: Apple's P/E is higher than in 89% of the weeks of the last ten years.Median P/E 28.7x 12.3x to 45.3x: its typical multiple and its range over the window.EPS $8.72 TTM Jun 2026: the trailing twelve-month EPS used today.- The lines: green
20x, olive30x, red40x. The white price line sits close to the red 40x line at the right edge. - The table: each EPS figure, when it became known, its growth, the price that week and the P/E then.
FY Sep 2025 ... 7.46 +22.7% ... 36.2x.
The two related charts:
GE AAPL, MSFT: P/E history for several tickers on one chart; in Series (s) switch to forward P/E, PEG, P/S, EV/EBITDA or price to free cash flow.GF MSFT, GOOGL, AMZN: quarterly revenue as grouped columns for several companies, with any other statement line one step away in Series.
Practice and recap
Try it3 tasks
- From the table: what P/E did Apple trade at when FY2022 EPS (6.11) became known? (25.5x.)
- If Apple's EPS stays at 8.72 and the P/E falls back to the median 28.7x, what price is that? (About 250 dollars.)
- Price rose 50% while EPS rose 10%. What happened to the multiple? (It expanded by about 36%: 1.5 / 1.1 = 1.36.)
Common mistakes4 mistakes
- Assuming a high percentile means the price must fall. Businesses change; multiples can stay high.
- Forgetting that the band uses trailing earnings: a fast grower always looks expensive on them.
- Comparing P/E histories across a period with a loss year (no P/E).
- Reading a revenue chart without margins: growing sales at falling profit is not the same story.
Check yourself3 questions
- Split a price into two parts.
- What does "90th percentile P/E" mean?
- Which function compares quarterly revenue across companies?
Answers
- Price = P/E multiple x earnings per share.
- Today's P/E is higher than in 90% of the past observations in the window.
GF.
Words in this lesson5 words
- multiple expansion / contraction
- Investors paying more / less for each dollar of earnings.
- P/E band
- Lines at fixed multiples of earnings drawn under the price.
- trailing EPS
- Earnings per share over the last twelve months.
- percentile (of a multiple)
- The share of past observations at or below today's value.
- lookback
- How far back a chart or ranking looks.
Educational material about reading market data, not investment advice.