The VIX and volatility indices (VIX, VOLS)
The VIX is the 30-day implied volatility of the S&P 500, and VIX and VOLS show its curve across horizons and its cousins in bonds, oil, gold and single stocks.
- 4 min
- 3 questions
- Lesson 4 of 4
Why you would care
Is the market scared, and of what horizon? "The VIX spiked" is how the evening news says "markets got scared". A trader wants more: is the fear short-term or long-term, and is it in stocks only or in bonds too? The shape of the VIX curve and the cross-asset board answer that in one glance.
The idea from scratch
What the VIX is
The VIX is computed by the options exchange that created it, from the prices of many S&P 500 options, across strikes, to give one number: the volatility the options price for the next 30 days, as a yearly %. A VIX of 16 means the market prices S&P 500 moves of about 16 / 16 = 1% a day (the rule of 16).
It tends to jump when stocks fall (people rush to buy protection), which is why it is called the "fear gauge".
The VIX curve
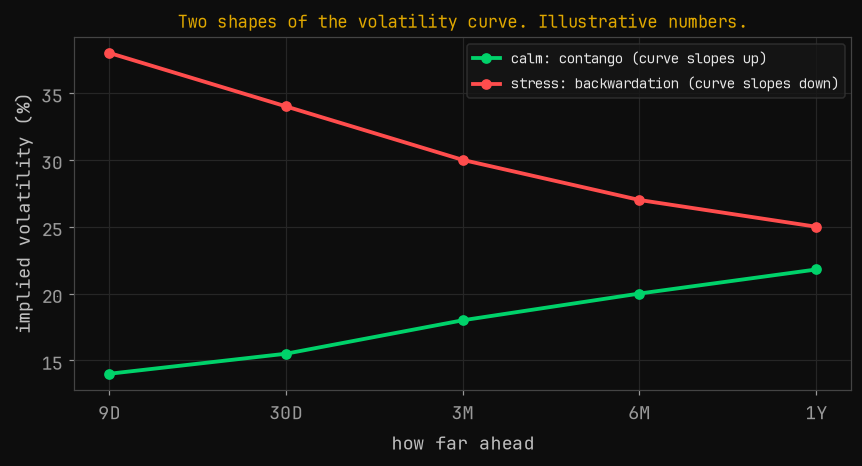
The same calculation at other horizons: VIX9D (9 days), VIX (30 days), VIX3M, VIX6M, VIX1Y. Line them up:
Contango
the curve slopes up. Normal and calm: more can happen over a year than over a month.
Backwardation (inverted)
short-term above long-term. Stress now, expected to fade.
The family
| Index | Measures |
|---|---|
| VVIX | Volatility of the VIX itself |
| SKEW | How expensive far out-of-the-money S&P puts are (tail risk) |
| MOVE | Implied volatility of US Treasury yields |
| VXN, RVX | Nasdaq 100, Russell 2000 |
| OVX, GVZ | Oil, gold |
| VXEEM, VXEWZ | Emerging markets, Brazil |
| VXAPL, VXAZN, VXGOG | Single stocks |

See it in Gloom
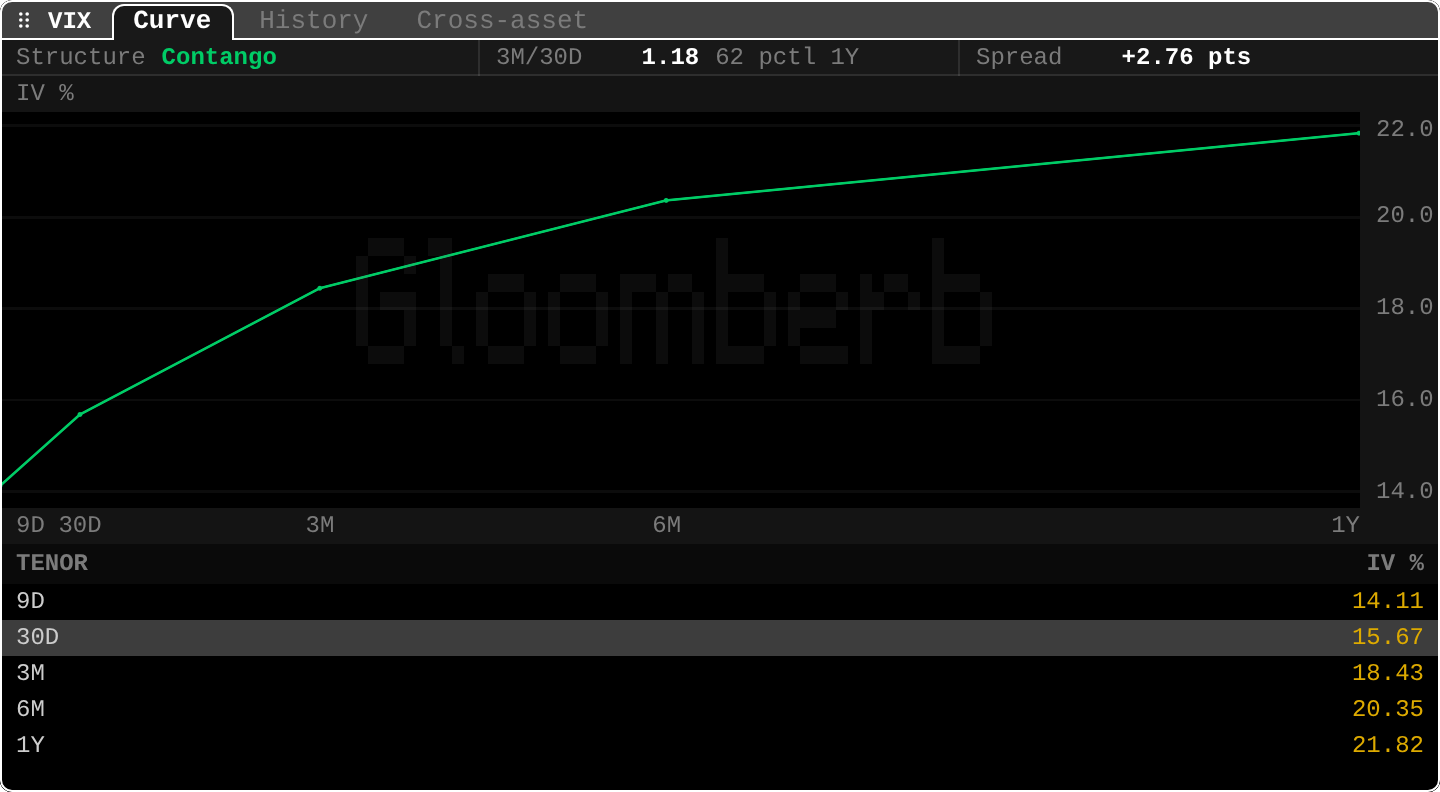
open ittype VIX (tabs Curve, History, Cross-asset) or VOLS for the board. Keys: v view, ←/→ step.
Structure Contango: the curve slopes up.- Table:
9D 14.11,30D 15.67,3M 18.43,6M 20.35,1Y 21.82. 3M/30D 1.18 62 pctl 1Y: three-month vol is 18% above one-month vol, a fairly normal ratio for the past year.Spread +2.76 pts: 3M minus 30D in volatility points.- VIX of 15.67 means S&P options price about 15.67 / 16 ≈ 1% a day.
VOLS lists every index with its daily change and one-year percentile (see the screenshot in What a volatility desk does): useful to spot fear in one market while others are calm.
Practice and recap
Try it3 tasks
- VIX at 32: roughly how much a day does the market price? (2%.)
- 9D 30, 30D 25, 3M 22. Contango or backwardation? (Backwardation: stress now.)
- In the screenshot, which tenor is highest? (1Y, 21.82.)
Common mistakes4 mistakes
- Thinking the VIX is the realized volatility of the S&P 500. It is implied, forward-looking.
- Reading a low VIX as "no risk". It means protection is cheap.
- Assuming you can buy "the VIX". You trade futures or options on it, which follow their own curve.
- Comparing VIX levels with single-stock vols: an index diversifies, so its vol is lower.
Check yourself3 questions
- What does the VIX measure?
- What is contango in the VIX curve?
- Name a volatility index for bonds.
Answers
- The 30-day implied volatility of the S&P 500, from index option prices.
- Longer-dated implied vol above shorter-dated: the curve slopes up, a calm market.
- MOVE.
Words in this lesson6 words
- VIX
- 30-day implied volatility of the S&P 500.
- contango (vol curve)
- Longer tenors higher than shorter ones.
- backwardation (inverted)
- Shorter tenors higher: stress now.
- tenor
- The horizon a value refers to (9D, 30D, 3M...).
- SKEW index
- A measure of how expensive far out-of-the-money S&P puts are.
- MOVE
- Implied volatility of US Treasury yields.
Educational material about reading market data, not investment advice.