Sentiment and market valuation (FNG, VAL)
FNG shows a fear-and-greed gauge built from seven market signals, and VAL shows whole-market valuation ratios against their own history.
- 4 min
- 3 questions
- Lesson 6 of 6
Why you would care
Is the market fearful or greedy, and is it cheap or expensive? Sentiment and valuation are the two thermometers of the market. Fear at extremes often comes near lows; greed near highs. High valuations mean lower long-run returns on average. Neither tells you what happens next month. Both tell you what kind of market you are in.
The idea from scratch
Sentiment
Sentiment is how optimistic or fearful investors feel. A fear and greed index combines several measurable signals into one number, typically: market momentum, the share of stocks at new highs vs lows, breadth, put/call ratios, volatility (VIX), demand for safe bonds vs stocks, and junk bond spreads. 0 to 25 extreme fear, 75 to 100 extreme greed.
Many investors read it contrarian: "be fearful when others are greedy". It is a mood reading, not a timing tool.
Market valuation
The same ratios as for one company (chapter 04), applied to the whole market:
- Buffett indicator
- Total stock market value / GDP
- CAPE (Shiller P/E)
- Price / average of the last ten years of inflation-adjusted earnings
- Equity risk premium (excess CAPE yield)
- Earnings yield (1 / CAPE) minus the real bond yield: what stocks pay over safe bonds
- Tobin's Q
- Market value / replacement value (a proxy)
- Dividend yield
- Dividends / price for the S&P 500
- Margin debt / GDP
- Borrowing to buy stocks, relative to the economy

See it in Gloom
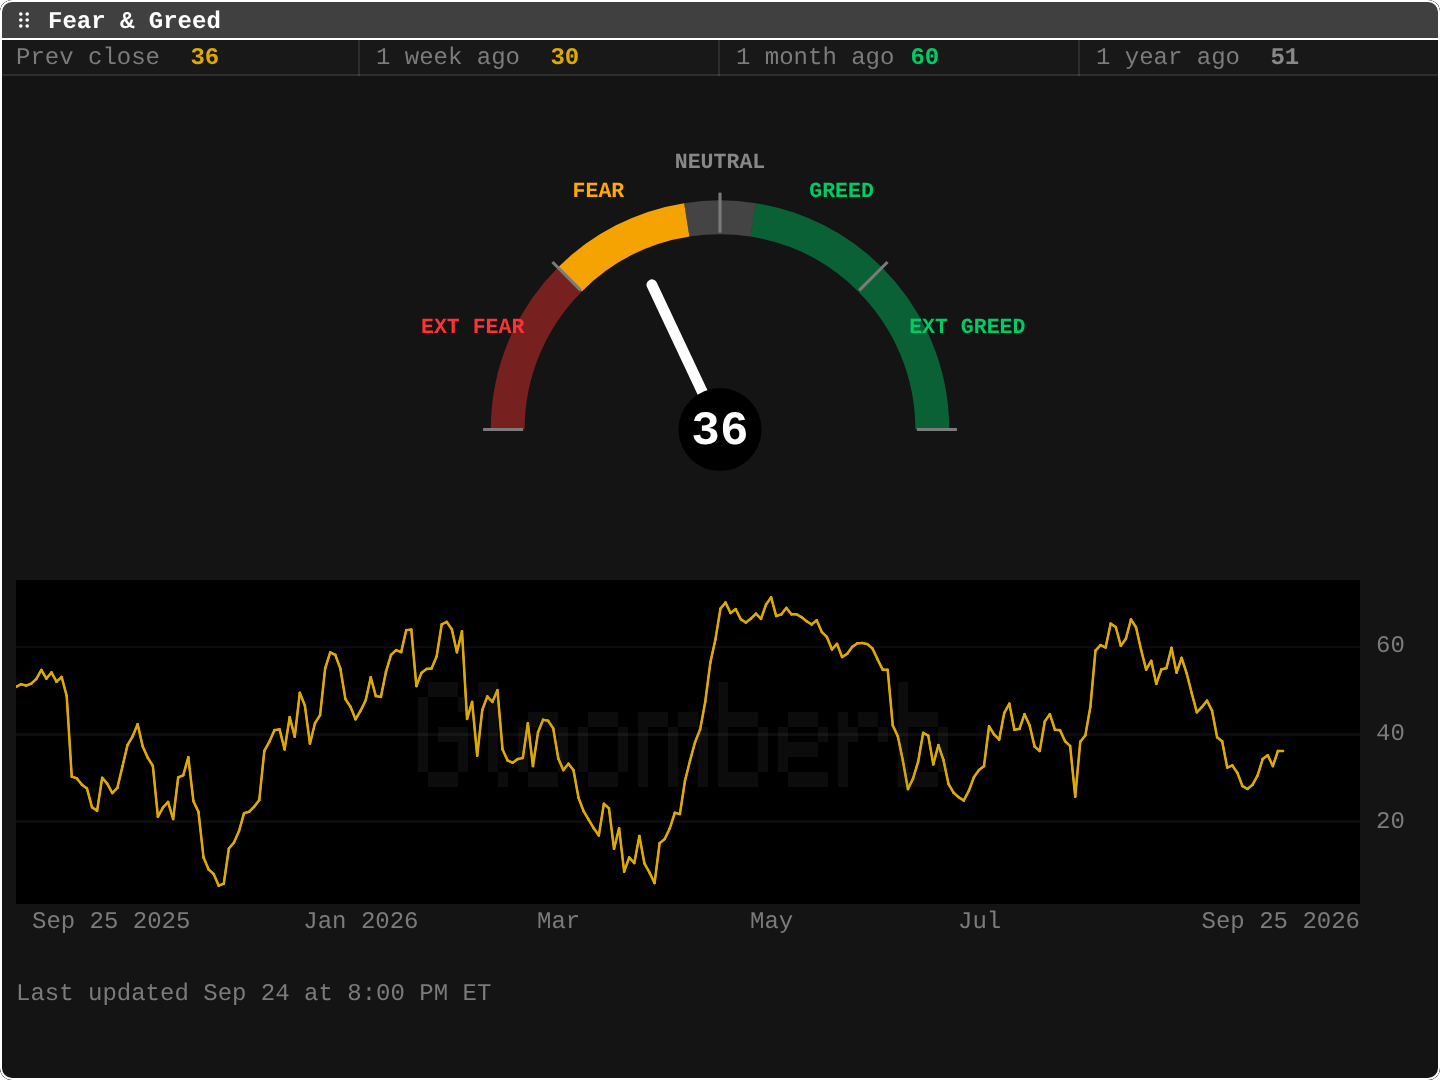
open themtype FNG and VAL.
- FNG
36: fear.1 week ago 30,1 month ago 60: sentiment swung from greed to fear in a month. - The history line: extreme fear lows in late 2025 and March 2026, greed peaks in May.
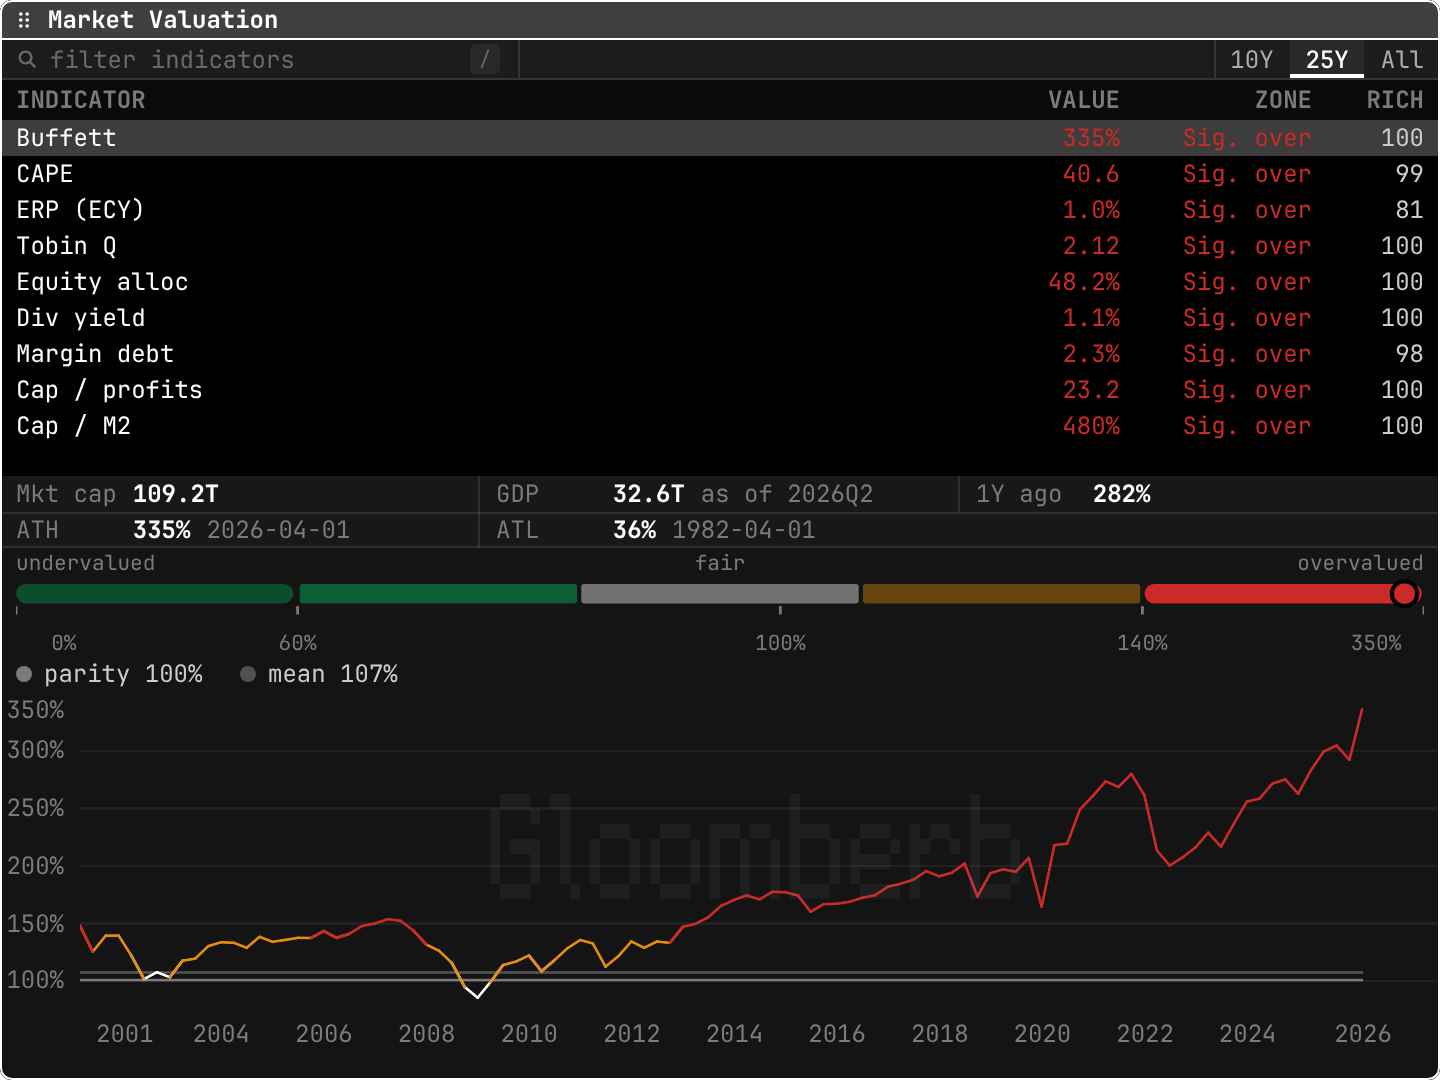
- VAL
Buffett 335% Sig. over 100: total equity value is 3.35 times GDP, the richest on record in the window. CAPE 40.6,ERP (ECY) 1.0%: expensive, with a small premium over real bond yields.Div yield 1.1%: low, consistent with high prices.- The zone bar: undervalued to overvalued; the marker at the far right.
Practice and recap
Try it3 tasks
- Is the FNG reading in the screenshot fear or greed? (Fear, 36.)
- CAPE 40: earnings yield? (2.5%.)
- Why can a market stay "significantly overvalued" for years? (Valuation predicts long-run returns, not timing; earnings can grow into prices.)
Common mistakes4 mistakes
- Using sentiment or valuation to time the next week.
- Comparing CAPE across eras without noting accounting and interest-rate changes.
- Reading "fear" as "about to rise".
- Forgetting that all these ratios can stay extreme for long periods.
Check yourself3 questions
- What does the fear and greed index combine?
- What is CAPE?
- What does the Buffett indicator compare?
Answers
- Several market signals (momentum, breadth, options, volatility, safe-haven demand, junk bond spreads) into one 0-100 score.
- Price divided by ten years of average inflation-adjusted earnings.
- The total value of the stock market to the size of the economy (GDP).
Words in this lesson7 words
- sentiment
- How optimistic or fearful investors feel.
- contrarian
- Doing the opposite of the crowd's mood.
- Buffett indicator
- Total stock market value / GDP.
- CAPE (Shiller P/E)
- Price / 10-year average real earnings.
- equity risk premium
- What stocks are expected to pay over safe bonds.
- Tobin's Q
- Market value / replacement value of assets.
- margin debt
- Money borrowed to buy securities.
Educational material about reading market data, not investment advice.