A board of quotes (QQ)
QQ is a wall of tiles, one per ticker, each with the last price, today's change, a one-month sparkline and the month's low and high.
- 4 min
- 3 questions
- Lesson 2 of 4
Why you would care
How are your names doing right now? You follow eight stocks. Opening
DESfor each one, eight times a day, is slow. You want one glance: who is up, who is down, who has been drifting all month.
The idea from scratch
A quote is the current price picture for a ticker (last price, change on the day). A board shows many quotes at once.
Two kinds of change appear on each tile:
Change in dollars
last price minus yesterday's close. $335.91 against $337.02 is -1.11.
Change in percent
that dollar change divided by yesterday's close. -1.11 / 337.02 is -0.33%.
A sparkline is a tiny line chart with no axes. It shows the shape of the last month, nothing more. A line that climbs from bottom-left to top-right means the price is higher than a month ago.
Colours follow a rule you will see everywhere in Gloom: green is up on the day, red is down on the day. The sparkline takes the same colour, so a red tile with a rising sparkline is a stock that is down today but up over the month. Both can be true.
See it in Gloom
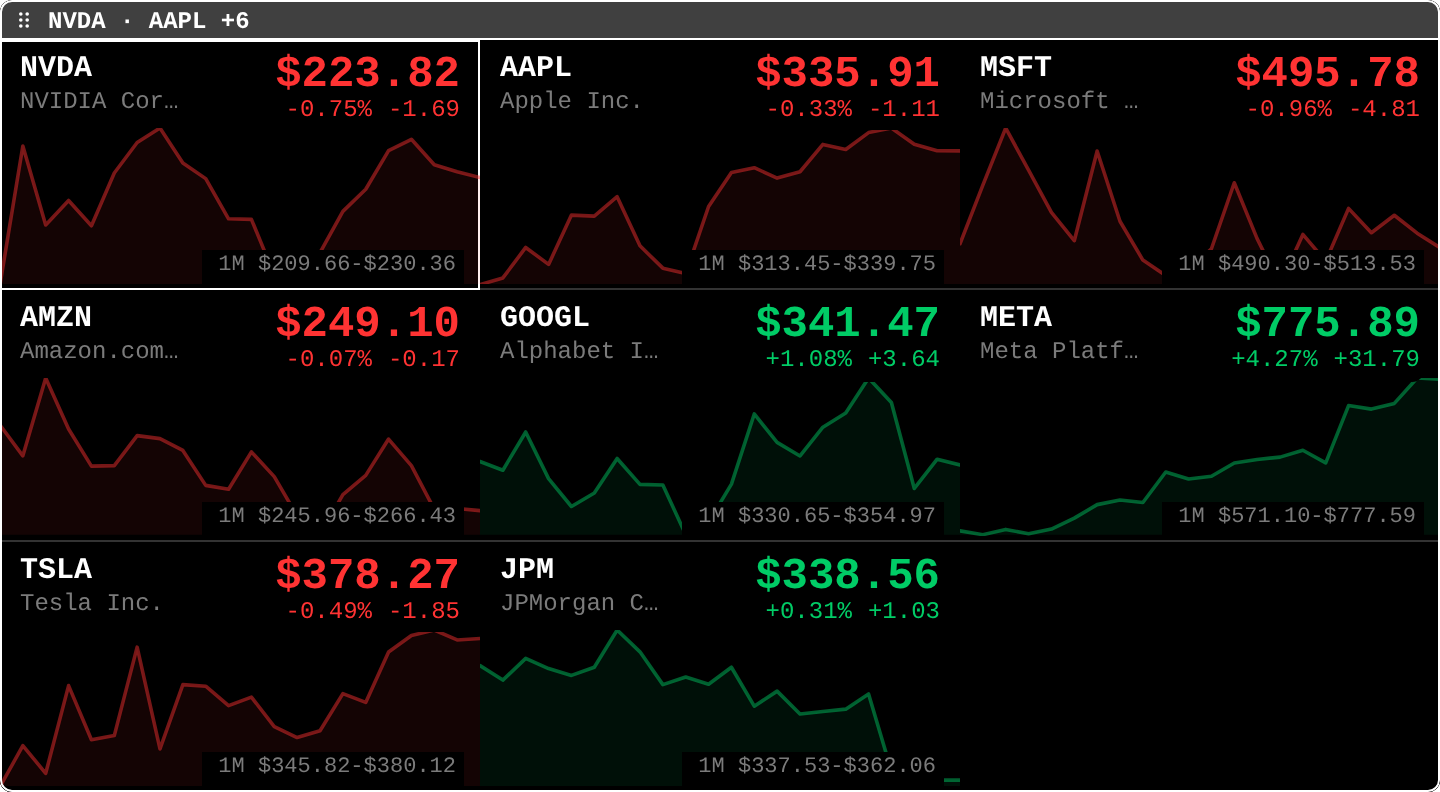
open ittype QQ NVDA, AAPL, MSFT in the command bar (any list, separated by commas).
The tour of one tile, NVDA top-left:
- Ticker and name.
NVDA, NVIDIA Cor... (names are cut to fit). - Last price. $223.82 in red: down on the day.
- Day change. -0.75% and -1.69, percent first, then dollars.
- Sparkline. The last month's shape: a bump, a dip, a recovery.
- 1M range.
$209.66-$230.36: the lowest and highest price in that month.
Compare META (bottom right of the second row): green, +4.27% today, and a sparkline climbing from $571.10 to $777.59. Up on the day and up for the month.
Keys: t edits the list of tickers, Enter opens the selected ticker's DES page. The pane title shows the first two tickers and +6 for the rest.
Practice and recap
Try it3 tasks
- In the screenshot, find the tile that is down on the day but near the top of its one-month range. (Look at TSLA: -0.49% but $378.27 against a range topping at $380.12.)
- Which tile moved the most in dollars today? Which in percent? Are they the same tile?
- Pick a tile and check the arithmetic: dollar change divided by (price minus dollar change) should give the percent change.
Common mistakes3 mistakes
- Reading the sparkline as a forecast. It is the past month, drawn small.
- Mixing up the two changes. The percent is comparable across tickers; the dollar change is not. META's +$31.79 is +4.27% on a $776 stock; the same $31.79 on a $100 stock would be +32%.
- Forgetting the board shows price change only, not dividends.
Check yourself3 questions
- A tile shows $50.00 and -2.00%. What was yesterday's close, roughly?
- A tile is red with a sparkline that rises all month. What does that mean?
- Which key opens the full overview page from a tile?
Answers
- About $51.02 (50 / 0.98). Rounding to $51 is fine.
- Down today, but higher than a month ago.
Enter.
Words in this lesson4 words
- quote
- the current price picture: last price and change on the day
- day change
- last price minus yesterday's close, in dollars or in percent
- sparkline
- a tiny chart with no axes showing the shape of recent prices
- 1M range
- the lowest and highest price in the last month
Educational material about reading market data, not investment advice.