Oil and gas inventories (DOE, NGS)
DOE and NGS show the weekly US government counts of crude, products and natural gas in storage against last year and the five-year range.
- 4 min
- 3 questions
- Lesson 4 of 7
Why you would care
Is supply tightening or loosening this week? On Wednesday mornings at 10:30 New York time, oil can move 2% in a minute. The trigger is the weekly inventory number. Gas has its own report on Thursdays. Inventories are the simplest gauge of supply and demand: stocks fall when demand beats supply.
The idea from scratch
Inventories (stocks) are barrels of oil or cubic feet of gas in storage tanks, pipelines and caverns. Each week:
- A build is an increase: supply exceeded demand.
- A draw is a decrease: demand exceeded supply.
Inventories are seasonal: gasoline stocks fall into summer driving season, gas storage fills from April to October and empties in winter. So a raw number means little. Compare with:
- Last year at the same week.
- The five-year average and range for that week.
Like all data, the surprise matters: the market has a forecast for the week's build or draw.
Key US series:
| Series | Why it matters |
|---|---|
| Commercial crude | The headline number (excludes the government reserve) |
| Cushing, Oklahoma | The delivery hub of the WTI futures contract |
| SPR (Strategic Petroleum Reserve) | The government's emergency stock |
| Gasoline, distillates | Refined products: driving and diesel demand |
| Working gas in storage (Lower 48, by region) | The natural gas balance |

See it in Gloom
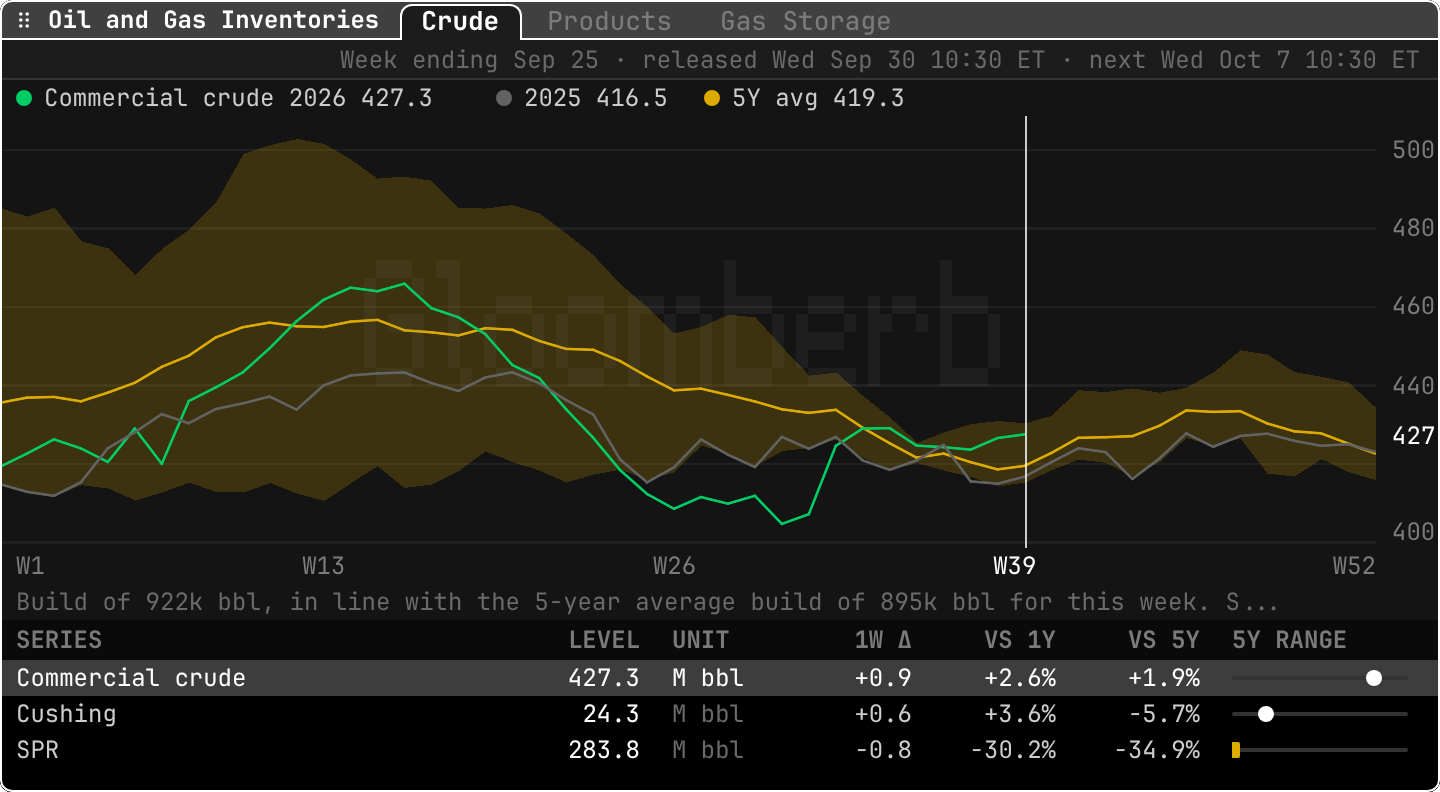
open ittype DOE (tabs Crude, Products, Gas Storage), or NGS to open the gas tab directly.
- Top line:
Week ending Sep 25 · released Wed Sep 30 10:30 ET · next Wed Oct 7 10:30 ET. - Legend:
Commercial crude 2026 427.3,2025 416.5,5Y avg 419.3, in millions of barrels. - The summary line:
Build of 922k bbl, in line with the 5-year average build of 895k bbl for this week. - Row
Cushing 24.3 M bbl +0.6 +3.6% -5.7%: the futures delivery hub, below its five-year norm. - Row
SPR 283.8 -30.2% vs 1Y: the government reserve far below last year. 5Y RANGEdots: where this week sits in the five-year range for this week.
Practice and recap
Try it3 tasks
- Was this week a build or a draw for commercial crude? (A build of 0.9 million barrels.)
- Is commercial crude above or below its five-year average? (Above: 427.3 vs 419.3, +1.9%.)
- Why compare with the same week of past years rather than last week? (Inventories are seasonal.)
Common mistakes4 mistakes
- Reading a build as bearish without the forecast.
- Ignoring seasonality.
- Mixing commercial crude with the SPR.
- Forgetting products: a crude build with large gasoline draws can still mean tight markets.
Check yourself3 questions
- What is a draw?
- Why does Cushing matter?
- Which day is the gas storage report?
Answers
- A fall in inventories: demand exceeded supply that week.
- It is the delivery point of the WTI crude futures contract.
- Thursday (oil on Wednesday).
Words in this lesson7 words
- inventories (stocks)
- Barrels or cubic feet in storage.
- build / draw
- A weekly increase / decrease in inventories.
- EIA
- The US Energy Information Administration, which publishes the reports.
- Cushing
- The Oklahoma hub where WTI futures are delivered.
- SPR
- The US Strategic Petroleum Reserve.
- five-year range
- The lowest to highest value for the same week over five years.
- bbl
- Barrels.
Educational material about reading market data, not investment advice.