Movers, new highs and lows, halts (MOST, HILO, HALT)
MOST lists today's biggest gainers, losers and most active stocks, HILO counts new session highs and lows live, and HALT lists trading halts.
- 4 min
- 3 questions
- Lesson 4 of 6
Why you would care
What is moving unusually today? Most of the market is quiet on any given day. The action is in a few names: a 100% gainer on news, a stock halted pending an announcement, a wave of new lows across the market. These three screens are the radar for "something is happening".
The idea from scratch
Movers
Gainers / losers
the largest % moves today.
Most active
the most shares traded. Often penny stocks (very low prices, so huge share counts) and leveraged ETFs.
Trending
what people are looking up.
Volume vs average (V/AVG)
today's volume / the usual daily volume. 3x means three times the normal activity.
Gaps
stocks that opened far from yesterday's close.
Price matters: a 100% gain on a 3-dollar stock is a few dollars per share, often in very thin trading.
New highs and lows
A new high is a price above everything earlier in the window (the session, or 52 weeks). Counting how many stocks make new highs versus new lows is a breadth gauge: a rising index with more new lows than new highs is a weak rally.
Halts
A trading halt stops trading in one stock, declared by its listing exchange. Common reasons (codes):
- T1
- News pending: the company is about to release material news
- T12
- Additional information requested by the exchange
- H11
- Regulatory concern
- LUDP
- A volatility pause: the price moved too fast (limit up, limit down)
Halts usually last minutes to hours; some last for months when a company has problems.

See it in Gloom
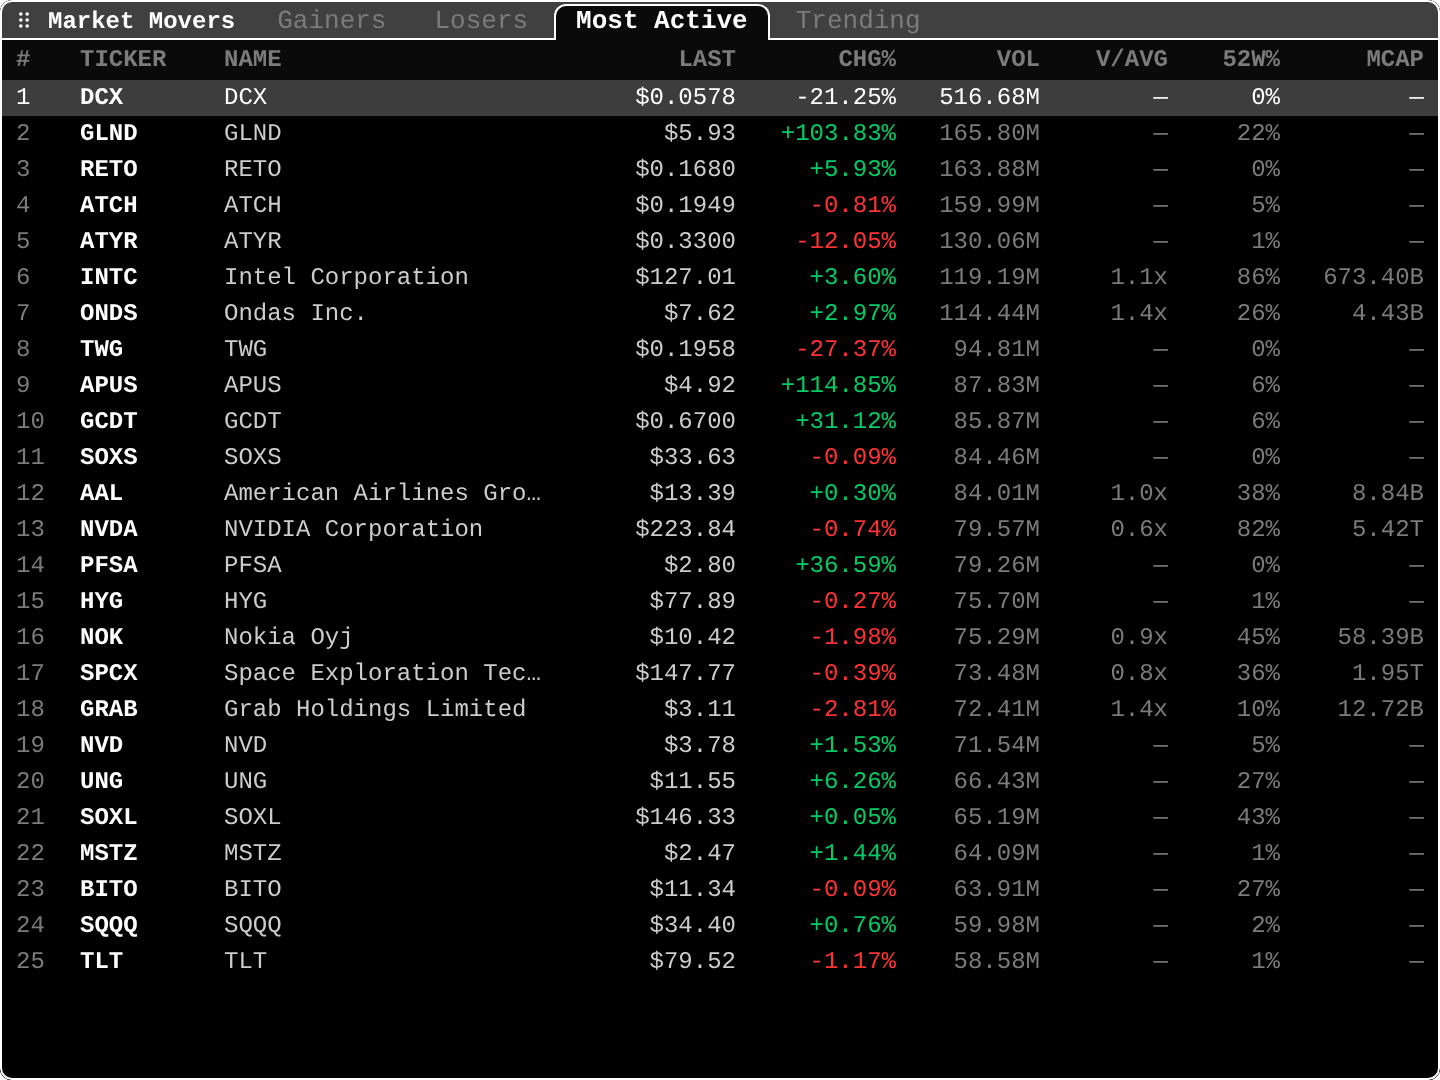
open themMOST (tabs Gainers, Losers, Most Active, Trending, plus pre-market and after-hours lists), HILO, HALT.
DCX $0.0578 -21.25% 516.68M: a sub-penny stock tops the volume list.INTC $127.01 +3.60% 119.19M 1.1x 86% 673.40B: a large company with normal relative volume (1.1x), near the top of its 52-week range (86%).SOXS,SOXL,SQQQ: leveraged ETFs, always among the most active.- A dash in V/AVG and MCAP: no average or market cap for that name.
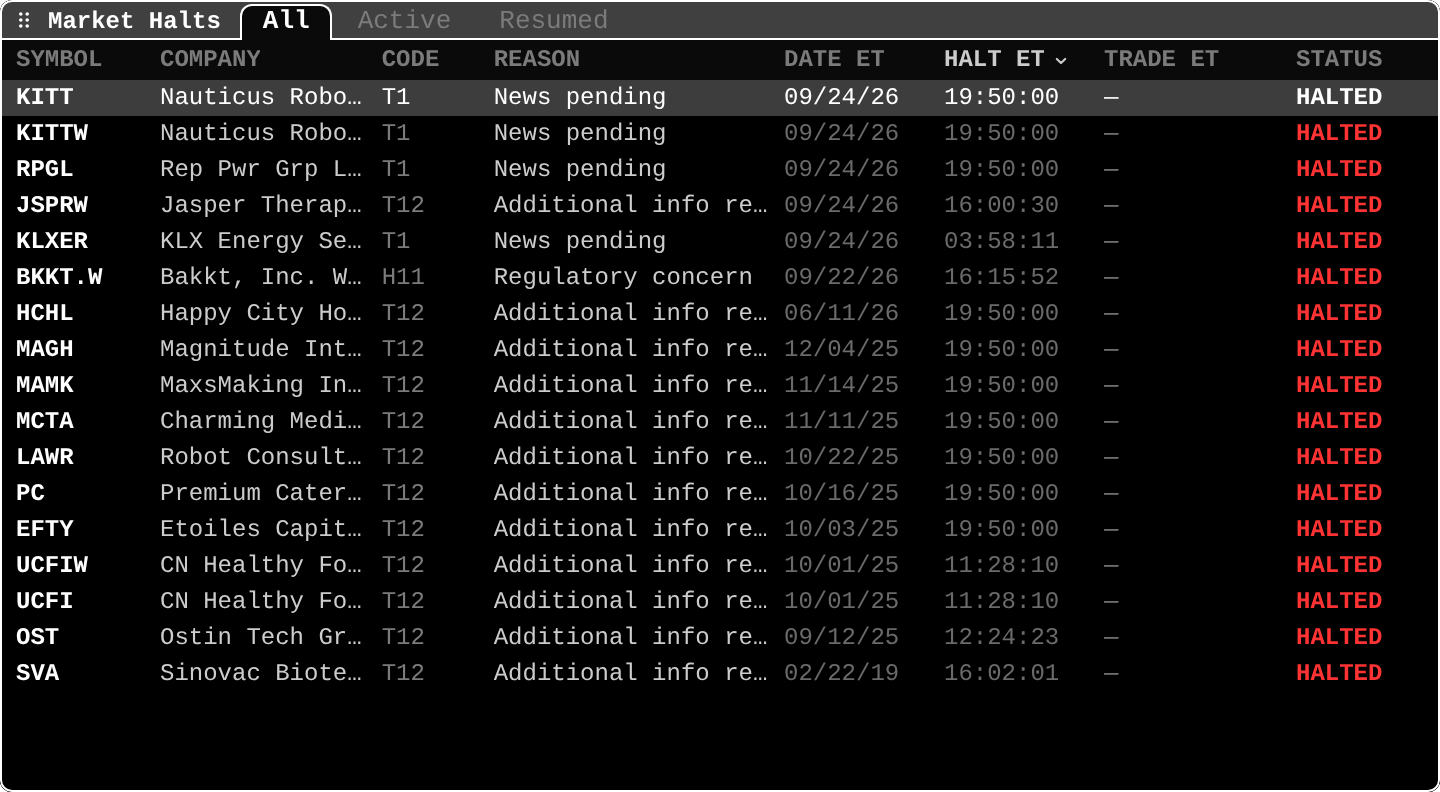
KITT T1 News pending 09/24/26 19:50:00 HALTED: halted ahead of news.SVA ... 02/22/19 HALTED: some halts last for years. Newer versions move halts older than 30 days to their ownLong-termtab, next toAll,ActiveandResumed.
HILO shows rolling 30-second, 1-minute and 5-minute counts of new session highs and lows across the US market.
Practice and recap
Try it3 tasks
- In MOST, which names traded 1.4 times their usual volume? (ONDS and GRAB; none of the biggest companies was above 1.1x.)
- What does halt code T1 mean? (News pending.)
- An index rises 1% but new lows outnumber new highs. Strong or weak rally? (Weak: narrow participation.)
Common mistakes4 mistakes
- Chasing the top gainer: thin, volatile, often reversed.
- Reading "most active" as "most important": share counts favor cheap stocks.
- Assuming a halt means bad news; T1 halts precede both good and bad announcements.
- Ignoring delays when acting on movers.
Check yourself3 questions
- What is volume vs average?
- What does new highs vs new lows measure?
- Who decides a trading halt?
Answers
- Today's volume divided by the stock's usual daily volume.
- Market breadth: how many stocks participate in a move.
- The stock's listing exchange (sometimes at a regulator's request).
Words in this lesson7 words
- gainers / losers / most active
- Biggest % rises / falls / highest share volume today.
- penny stock
- A very low-priced stock, often thinly traded.
- leveraged ETF
- A fund that aims for a multiple of an index's daily move.
- new high / new low
- A price above / below everything earlier in the window.
- breadth
- How many stocks take part in a move.
- trading halt
- A pause in one stock's trading, declared by its exchange.
- limit up / limit down
- A volatility pause when the price moves too fast.
Educational material about reading market data, not investment advice.