Money markets and liquidity (BTMM)
BTMM shows where banks, funds and the government borrow for a night to a year: overnight rates, the Treasury bill curve, and the Fed's balance-sheet liquidity.
- 4 min
- 3 questions
- Lesson 4 of 6
Why you would care
Is short-term funding calm, and what do bills say about the Fed? Every financial crisis has a money-market chapter: when overnight funding seizes up, banks and funds must sell assets fast. In calm times, bill yields tell you what the market expects the Fed to do over the next months. The plumbing is invisible until it breaks;
BTMMmakes it visible.
The idea from scratch
Overnight rates
| Rate | What it is |
|---|---|
| SOFR (secured overnight financing rate) | The cost of overnight loans backed by Treasuries (repo: you sell a bond and buy it back tomorrow) |
| EFFR (effective fed funds rate) | The average rate banks charge each other for unsecured overnight loans of reserves |
| IORB (interest on reserve balances) | What the Fed pays banks on reserves parked with it; a floor-like anchor |
| OBFR | A broader overnight bank funding rate |
They all sit close to the Fed's target range. A spike in SOFR above the range is a stress signal.
Treasury bills
Bills are government debt of one year or less, sold at a discount (you pay 98 and get 100 at maturity). Their yields by maturity form the short end of the curve. A rising bill curve (1-year above 4-week) means the market expects higher rates ahead.
Liquidity
Three numbers from the Fed's weekly balance sheet:
Reserves
cash banks hold at the Fed. More reserves, more slack in the system.
TGA (Treasury General Account)
the government's cash account at the Fed. When it fills (tax receipts, debt sales), it drains reserves.
Reverse repo (RRP)
cash money funds park at the Fed overnight.
A rough net liquidity gauge = Fed assets - TGA - reverse repo.

See it in Gloom
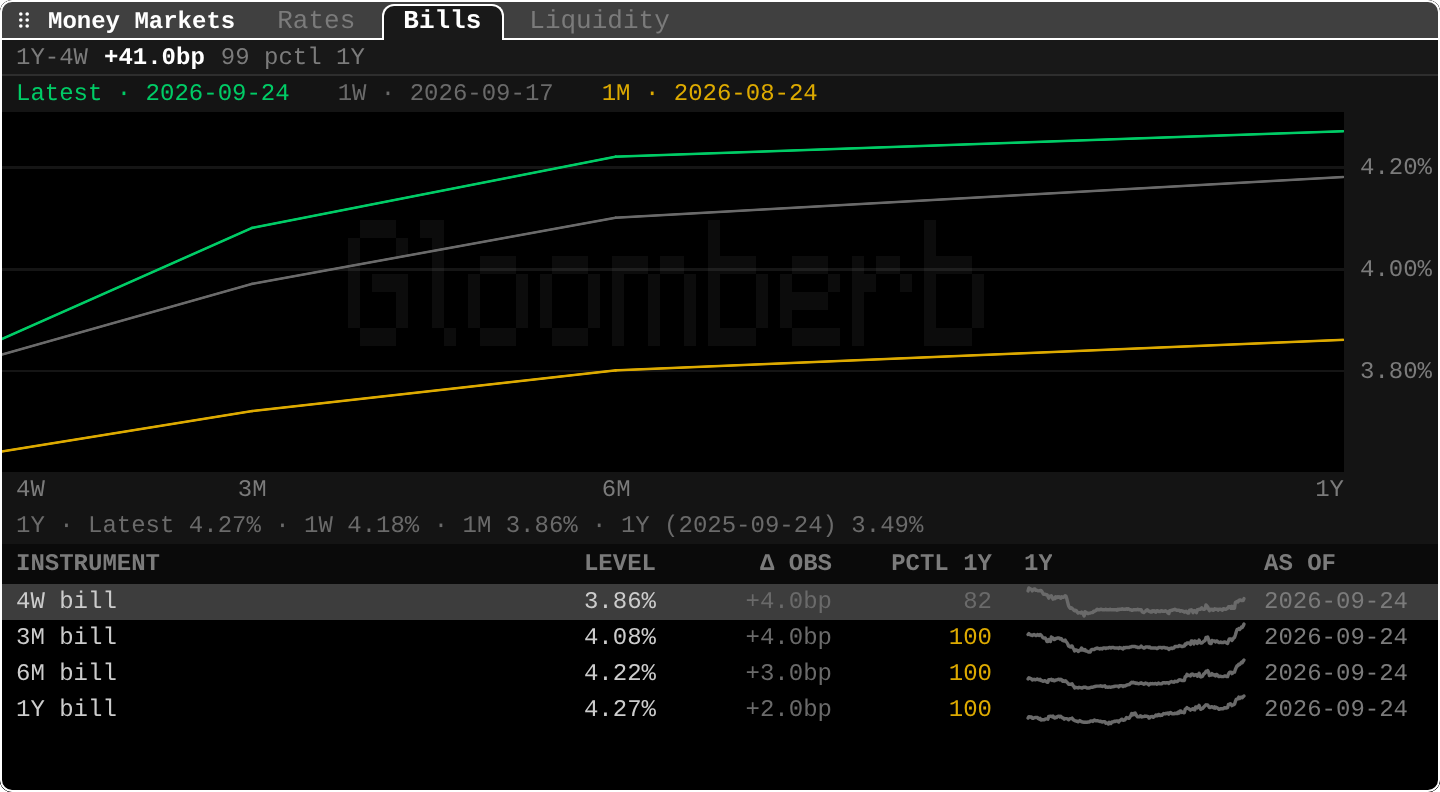
open ittype BTMM. Tabs: Rates (overnight), Bills, Liquidity.
1Y-4W +41.0bp 99 pctl 1Y: the bill curve is the steepest of the past year.- The three lines: today (green) well above one month ago (yellow): bill yields rose fast.
4W bill 3.86%,1Y bill 4.27%: higher yields further out, consistent with expected hikes (seeWIRP).PCTL 1Y 100for 3M, 6M and 1Y bills: at their highest of the past year.AS OF 2026-09-24: bills are published daily with a lag; the balance-sheet data weekly.
Practice and recap
Try it3 tasks
- In the screenshot, how much did the 1-year bill yield rise over the month? (The line under the chart: 1M 3.86%, latest 4.27%, so +41 bp.)
- A bill costs 98 and pays 100 in a year. Rough yield? (2 / 98 ≈ 2.04%.)
- The TGA rises by 200 billion and reverse repo is unchanged. What happens to reserves? (They fall by about 200 billion.)
Common mistakes4 mistakes
- Treating SOFR and EFFR as the same: one is secured, the other unsecured.
- Ignoring month-end and tax-date spikes, which are often technical.
- Reading net liquidity as precise; it is a rough gauge.
- Comparing bill discount yields with bond yields without converting.
Check yourself3 questions
- What is repo?
- What does a steep bill curve suggest?
- Name one thing that drains bank reserves.
Answers
- A short loan where one side sells a bond and agrees to buy it back later; the price difference is the interest.
- The market expects short-term rates to rise.
- A rising Treasury General Account (or more reverse repo).
Words in this lesson7 words
- money market
- Borrowing and lending for a night to a year.
- repo
- A short loan backed by bonds.
- SOFR / EFFR / IORB
- Secured overnight rate / fed funds effective rate / rate on reserves.
- Treasury bill
- Government debt of one year or less, sold at a discount.
- reserves
- Banks' cash at the central bank.
- TGA
- The US Treasury's cash account at the Fed.
- reverse repo (RRP)
- Cash parked at the Fed overnight by money funds.
Educational material about reading market data, not investment advice.