Building a position (OSA)
OSA turns several option legs into one position and shows its value at any stock price, date and volatility, with breakevens, maximum profit and loss, and the combined Greeks.
- 5 min
- 3 questions
- Lesson 2 of 2
Why you would care
What happens to this trade if the stock moves, time passes or volatility changes? Real option trades often have several legs: buy one call, sell another; buy a call and a put together. Their combined behavior is hard to see in your head.
OSAdraws it, and shows the two curves that matter: the value at expiry and the value today.
The idea from scratch
A strategy (or spread) combines legs: each leg is an option (or stock) that you buy or sell, with a quantity.
Three classic shapes:
| Strategy | Legs | You want |
|---|---|---|
| Bull call spread | Buy a call, sell a higher-strike call | A moderate rise, with capped cost and capped profit |
| Long straddle | Buy a call and a put at the same strike | A big move either way |
| Covered call | Own the stock, sell a call | A flat or slightly rising stock; you collect premium, give up upside |
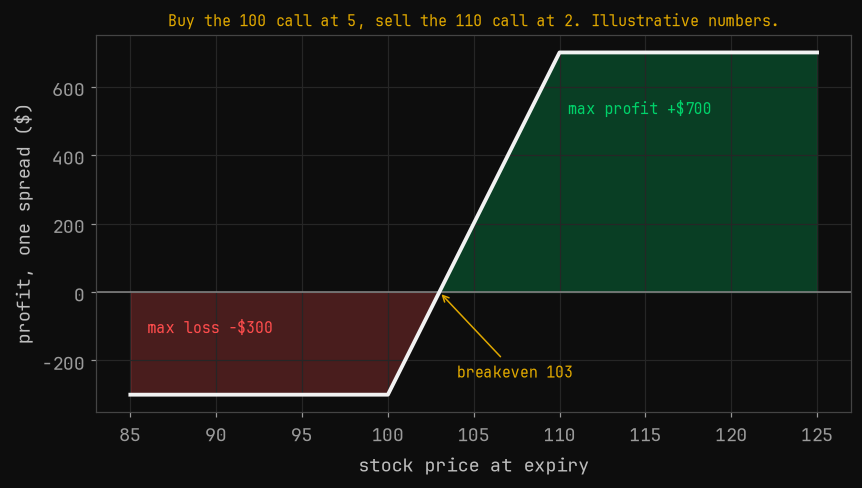
Two curves to keep apart:
At expiry
the hard-edged payoff, only intrinsic value left.
Today (or at a chosen date)
a smooth curve, because the options still have time value. It moves toward the expiry shape as days pass.
The position's Greeks are the sums of the legs' Greeks: they tell you the trade's sensitivity to price (delta), to movement (gamma), to time (theta) and to volatility (vega).

See it in Gloom
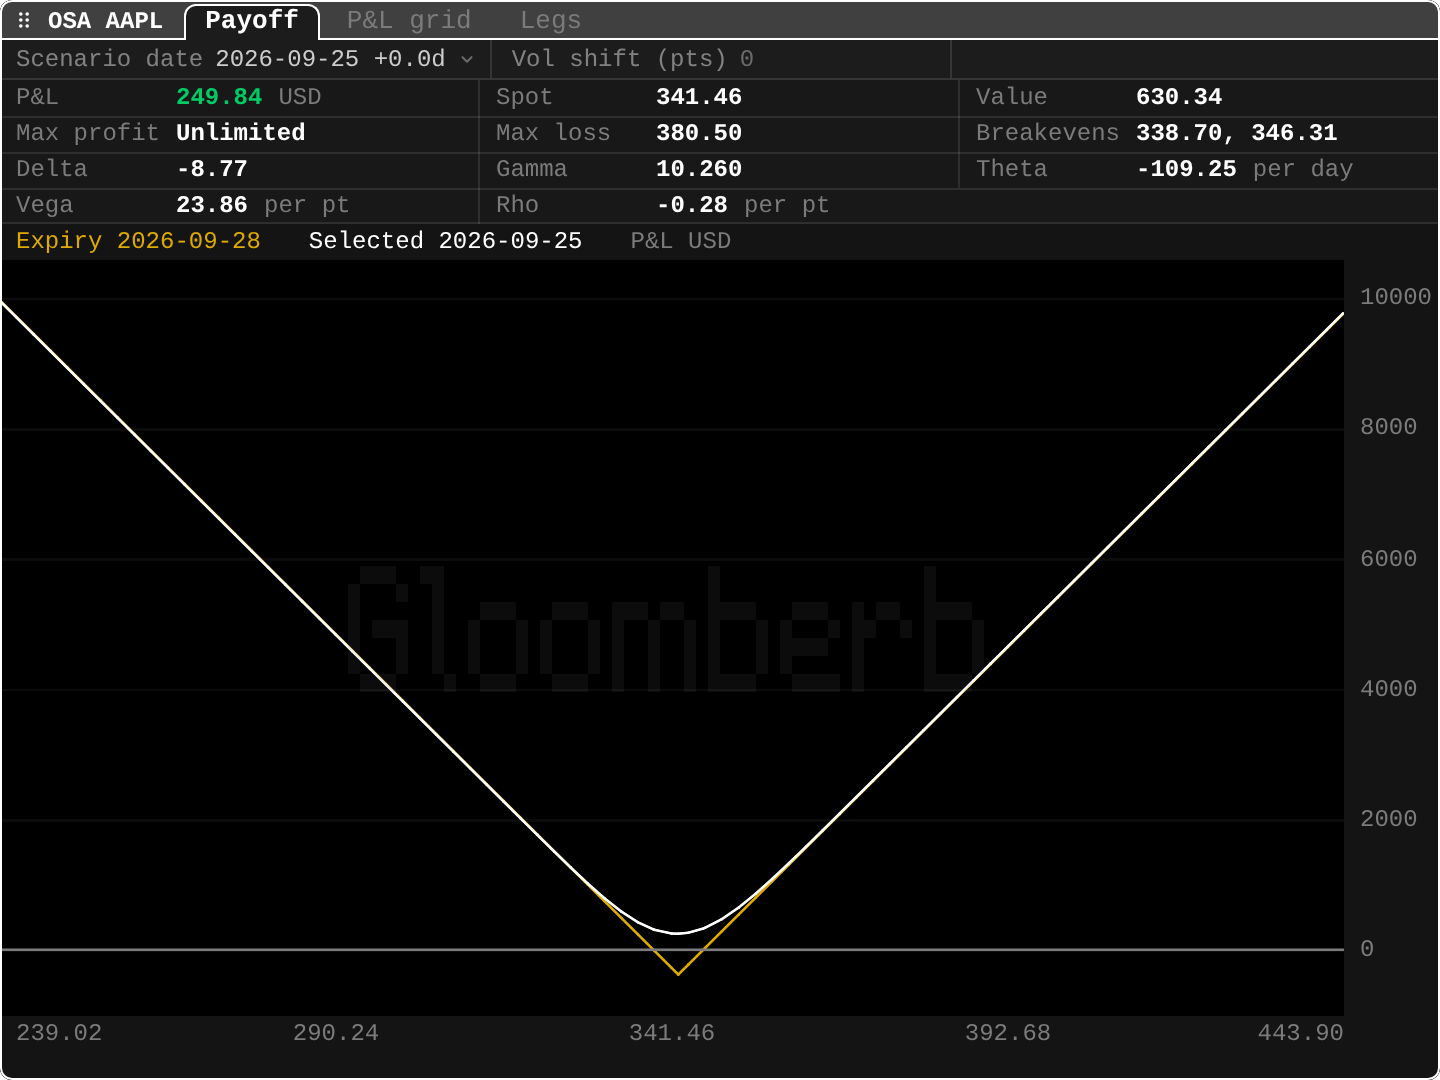
open ittype OSA AAPL, then a to add a leg, or c to pick from the chain (or press a on a contract in OMON). d changes the scenario date, v shifts volatility. Tabs: Payoff, P&L grid, Legs.
Spot 341.46,Value 630.34: the position's current value.Max loss 380.50,Max profit Unlimited: a long straddle costs its premium at worst; a big move either way has no cap.Breakevens 338.70, 346.31: at expiry, the stock must end outside this range for the trade to make money.Theta -109.25 per day: the position loses about 109 dollars a day if nothing moves. That is the price of being long gamma (Gamma 10.260).Vega 23.86 per pt: it gains about 24 dollars per point of implied volatility.- The chart: orange is the expiry payoff (the V); white is today's value, smoother and above it because time value remains.
Practice and recap
Try it3 tasks
- In the bull call spread chart, what is the profit if the stock ends at 106? ((106 - 100) - 3 = 3 per share: 300 dollars.)
- In the screenshot, how much does the straddle lose over a week if the stock does not move? (Roughly 7 x 109 = 765 dollars, and a little more in practice, because theta grows as expiry gets closer.)
- Which shape would you build to profit from a big move without guessing direction? (A long straddle.)
Common mistakes4 mistakes
- Reading only the expiry payoff and ignoring today's curve.
- Forgetting the multiplier: Greeks in
OSAare already in dollars for the position. - Selling options for premium without seeing the unlimited loss on the chart.
- Assuming American options behave exactly like the European pricing here (early exercise around dividends).
Check yourself3 questions
- What is a leg?
- Why is today's curve smoother than the expiry payoff?
- What do the breakevens of a long straddle mean?
Answers
- One option (or stock) line, bought or sold, inside a multi-part position.
- Because the options still have time value before expiry.
- The stock prices at expiry beyond which the trade makes money; between them, it loses.
Words in this lesson7 words
- strategy (spread)
- A position combining several option legs.
- leg
- One option or stock line in a strategy.
- bull call spread
- Buy a call, sell a higher-strike call.
- long straddle
- Buy a call and a put at the same strike.
- covered call
- Own the stock and sell a call on it.
- scenario
- A chosen date, price and volatility to value the position at.
- P&L grid
- A table of profit and loss across prices and dates.
Educational material about reading market data, not investment advice.