The price history table (HP)
HP is the chart turned into rows: one line per bar with open, high, low, close, the change from the bar before, and volume.
- 4 min
- 3 questions
- Lesson 1 of 4
Why you would care
What exactly was the price on that date? A chart tells you the shape. Sometimes you need the number: "What did AAPL close at at the end of June 2026?" "How many shares traded the month it dropped 7%?" You could squint at a chart. Or you can read the row.
The idea from scratch
Every candle on a chart is built from five numbers, often written OHLCV:
| Letter | Means | Plain words |
|---|---|---|
| O | open | first trade of the period |
| H | high | highest trade |
| L | low | lowest trade |
| C | close | last trade |
| V | volume | how many shares traded |
HP adds two columns you can compute yourself:
CHG
this close minus the previous row's close, in dollars.
CHG %
that change divided by the previous close.
Illustrative: last month closed at $316.85, this month at $335.92. CHG = 335.92 - 316.85 = $19.07. CHG % = 19.07 / 316.85 = +6.02%.
One row is one bar, and the bar size follows the range
On short ranges (1D, 1W) each row is an intraday bar with a time. On longer ranges each row covers more time. On ALL, the default, each row is one month.
Old prices are adjusted for splits
A stock split cuts every share into several smaller ones. After a 4-for-1 split you own 4 times the shares, each worth a quarter as much. Nothing real changed, but the price drops by 75% overnight.
To keep charts readable, old prices are divided by every split since. That is why AAPL's first month in HP AAPL (December 1980) shows a close of about $0.15: Apple's shares have been split many times since, so its old prices are divided down to match today's shares. Nobody actually traded Apple at 15 cents.
See it in Gloom
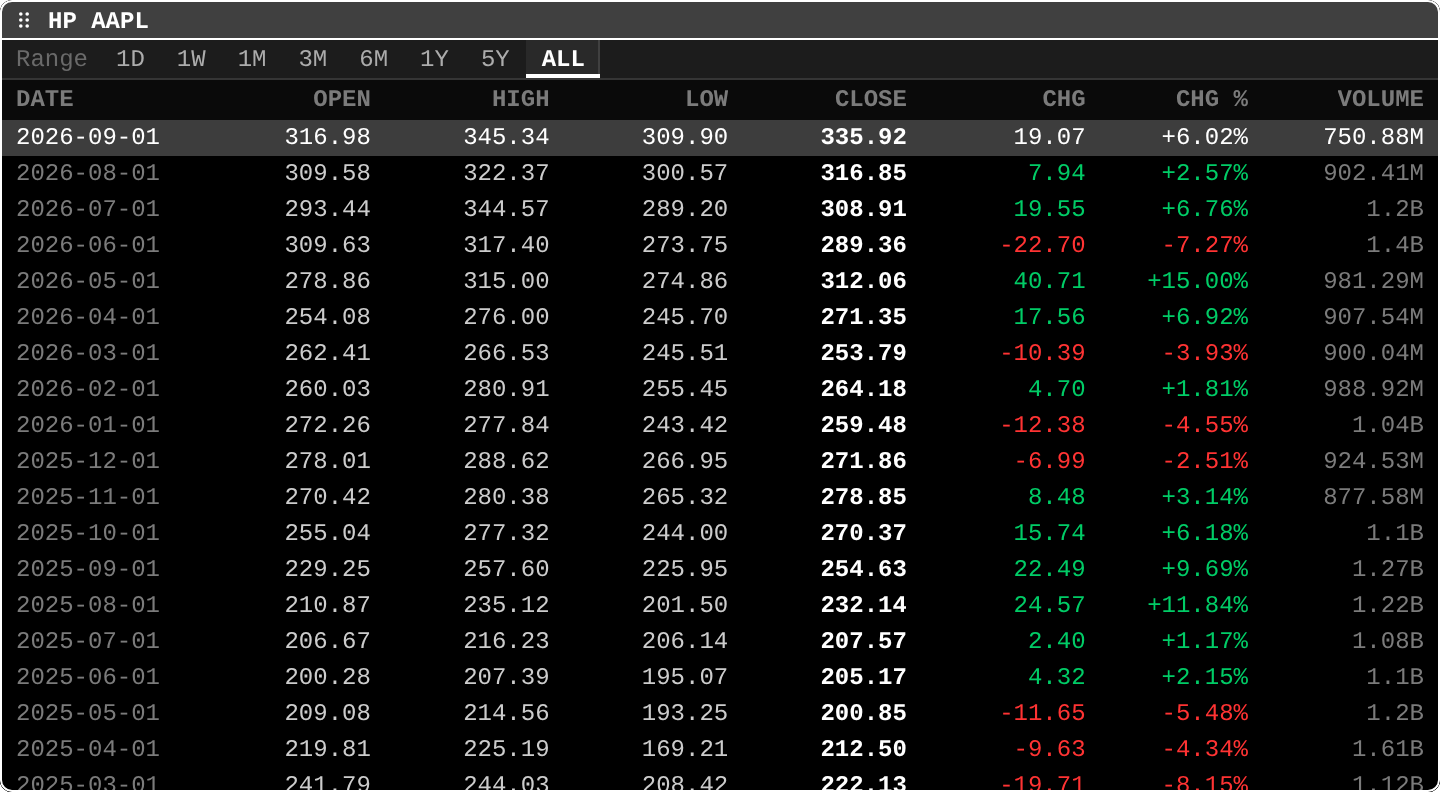
open ittype HP AAPL.
The tour:
- Range, top:
ALLis selected (the default). Presstto change it. - DATE:
2026-09-01is the month of September 2026. Newest at the top. - OPEN, HIGH, LOW, CLOSE: September opened at $316.98, reached $345.34, dipped to $309.90 and closed (so far) at $335.92. The close is in bold.
- CHG and CHG %: +19.07 and +6.02% against August's close of $316.85. Green up, red down.
- VOLUME: 750.88M shares in September so far, against 902.41M in August.
- Scroll down: June 2026 lost 7.27% on 1.4B shares, one of the busier months in view.
Practice and recap
Try it3 tasks
- Check the arithmetic on May 2026: close $312.06, previous close $271.35. Do you get +40.71 and +15.00%?
- Find the month with the biggest high-to-low swing in the screenshot. (Hint: April 2025, $225.19 to $169.21.)
- Compare the volume of the up months and the down months. Is there a pattern, or not?
Common mistakes4 mistakes
- Reading the top row as a finished month.
- Comparing an old price with today's without noticing it was adjusted for splits.
- Treating CHG % as a return with dividends. It is price only.
- Forgetting that one row's size depends on the range: a row on
ALLis a month, not a day.
Check yourself3 questions
- Previous close $50, close $52. What are CHG and CHG %?
- Why does Apple show a price of about $0.15 in 1980?
- Which column tells you how busy trading was?
Answers
- +$2.00 and +4.00%.
- Old prices are divided by every stock split since, so they match today's shares.
- VOLUME.
Words in this lesson4 words
- OHLCV
- open, high, low, close, volume: the five numbers behind a bar
- CHG / CHG %
- change from the previous close, in dollars / in percent
- stock split
- cutting each share into several smaller ones; value unchanged
- split-adjusted
- old prices divided by later splits so they compare with today's
Educational material about reading market data, not investment advice.