Portfolios and watchlists (PF, AP, AW, RP, RW)
PF shows what you own (positions, cost, profit and loss) and what you follow (watchlists) with live prices, and AP, AW, RP and RW add or remove tickers from anywhere.
- 5 min
- 3 questions
- Lesson 1 of 8
Why you would care
How are your positions doing today, and since you bought them? Every morning starts with the same two questions: what did my holdings do overnight, and what is moving among the names I watch?
PFanswers both on one screen, and everything else in Gloom (alerts, risk, news, theses) uses these lists as its starting point.
The idea from scratch
- A portfolio is a list of positions: for each ticker, how many shares you hold and your average cost (what you paid per share, on average).
- A watchlist is a list of tickers you follow, with no quantities.
From a position, three numbers follow:
- Market value = shares x current price.
- Unrealized P&L (profit and loss) = market value - what you paid. "Unrealized" because you have not sold: it is profit on paper.
- Weight = this position's market value / the whole portfolio's market value.
Day change is how much the portfolio moved since yesterday's close. P&L is since you bought. Do not confuse them.
Two ways to fill a portfolio
Manual
you type tickers, shares and costs (
AP NVDAasks for them).Broker
you connect a brokerage account and positions sync on their own (lesson: Account and brokers). You cannot delete a broker position by hand: the next sync would put it back.

See it in Gloom
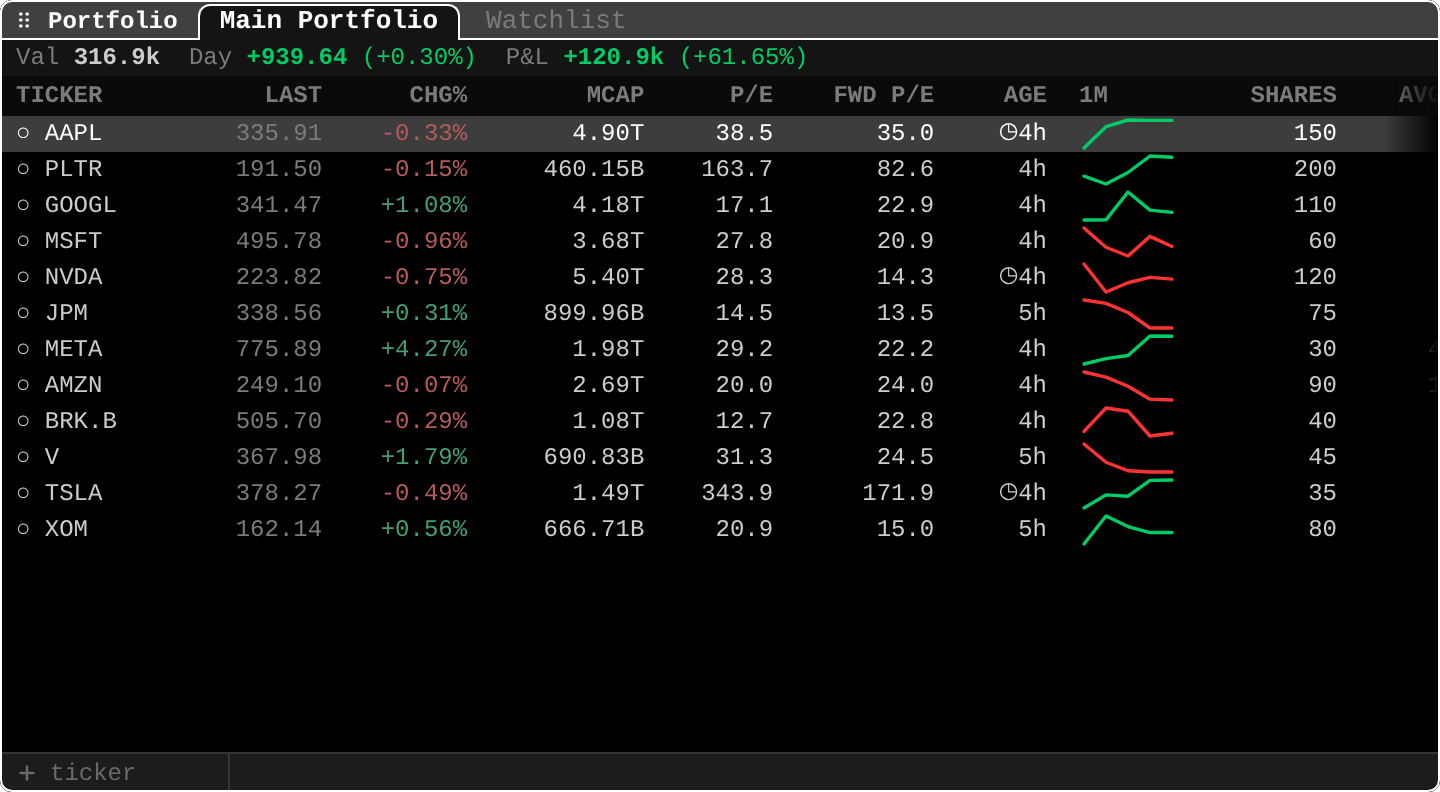
open ittype PF. Tabs on top switch between your portfolios and watchlists (h / l).
- Header
Val 316.9k: the total market value, 316,900 dollars. Day +939.64 (+0.30%): the change since the previous close.P&L +120.9k (+61.65%): unrealized profit since purchase. The cost was about 196,000 (316.9k - 120.9k).- Row
AAPL 335.91 -0.33% ... 150: last price, change today, and 150 shares held. Market value: 150 x 335.91 = about 50,400. MCAP,P/E,FWD P/E: company size and valuation (P/E is price divided by a year of earnings per share; FWD uses next year's estimate).AGEand1M: how old each quote is, and a one-month sparkline (a tiny chart).
The + ticker box at the bottom, or a, adds a ticker to the open list. In newer versions (after 0.15.8), d removes the selected one after a confirmation; in 0.15.8 use RW or RP. s switches to a grid view.
Adding and removing from anywhere
| Command | Does |
|---|---|
AW NVDA | Add to the active watchlist |
AP NVDA | Add to a manual portfolio, with optional shares, average cost and currency |
RW NVDA / RP NVDA | Remove from the watchlist / portfolio |
Practice and recap
Try it3 tasks
- In the screenshot, which position moved most today in percent? (META, +4.27%.)
- Compute the market value of the TSLA row: 35 shares x 378.27. (About 13,240 dollars.)
- In the app:
AW SPY, thenPF, then find the Watchlist tab.
Common mistakes4 mistakes
- Reading total P&L as today's gain. Day and P&L are different numbers.
- Forgetting that unrealized P&L is on paper until you sell.
- Deleting a broker position and waiting for it to vanish. Change it at the broker.
- Comparing P/E across very different companies without context (chapter 04).
Check yourself3 questions
- What is the difference between a portfolio and a watchlist?
- You hold 20 shares bought at 50, now 45. What is your unrealized P&L?
- Which command removes NVDA from your watchlist?
Answers
- A portfolio holds quantities and costs; a watchlist is just tickers to follow.
- 20 x (45 - 50) = -100 dollars, or -10%.
RW NVDA.
Words in this lesson9 words
- portfolio
- A list of positions with quantities and costs.
- watchlist
- A list of tickers you follow, with no quantities.
- position
- How much of one thing you hold in one portfolio.
- average cost
- What you paid per share, on average.
- market value
- Shares x current price.
- unrealized P&L
- Profit or loss on paper, on positions not yet sold.
- weight
- One position's share of the portfolio's value.
- sparkline
- A tiny chart inside a table cell.
- P/E, forward P/E
- Price divided by a year of earnings per share; forward uses the next year's estimate.
Educational material about reading market data, not investment advice.