Backtesting a rule (BT, BTST)
BT (also BTST) replays a simple buy-and-sell rule on a stock's daily history and compares it with buying and holding, trade by trade.
- 5 min
- 3 questions
- Lesson 4 of 4
Why you would care
Would this rule have worked, and should you believe the answer? "Buy when the 50-day average crosses above the 200-day." Rules like this are everywhere. Did they ever work? A backtest answers in seconds. Reading one well, including its traps, is a basic skill on any trading desk.
The idea from scratch
A trading rule says when to be in the market and when to be out, using only past prices. A backtest applies the rule day by day to history, as if you had followed it, and adds up the result.
The rule is always compared with buy-and-hold: buy on the first day, never sell. If a rule cannot beat doing nothing, it is not worth the effort.
The golden cross, the classic example
A moving average (SMA) is the average close of the last N days (taught in Moving averages, RSI and MACD). The golden cross rule:
- Be in while the 50-day average is above the 200-day average (the trend is up).
- Be out (in cash) while it is below.
BT tests long-only rules: you either own the stock or hold cash, never short.
The scorecard
- Total return
- Growth over the whole test
- CAGR
- The steady yearly growth rate that gives the same total
- Volatility (ann.)
- How much the daily value swung, per year
- Sharpe
- Return per unit of volatility; higher means a smoother ride for the gain
- Max drawdown
- The worst fall from a peak
- Time in market
- Share of days invested
- Hit rate
- Share of trades that made money
- Profit factor
- Total gains of winners / total losses of losers
Why a backtest lies
Overfitting
try 50 rules, keep the best one, and it will look great on the past and fail on the future.
Few trades
five trades is five data points. Luck dominates.
Costs
every buy and sell costs a spread and fees.
BTcharges a cost per side in basis points (1 bp = 0.01%), 5 by default.One stock, one period
a rule that worked on a stock that rose 12-fold may only reflect that stock.
The future is different
markets change, and popular rules get crowded.
- Rule: in when SMA50 > SMA200
- Daily history, 10 years
- Simulated trades, minus costs
- Compare with buy-and-hold
- Better?
- Check: number of trades, other stocks, other periods
See it in Gloom
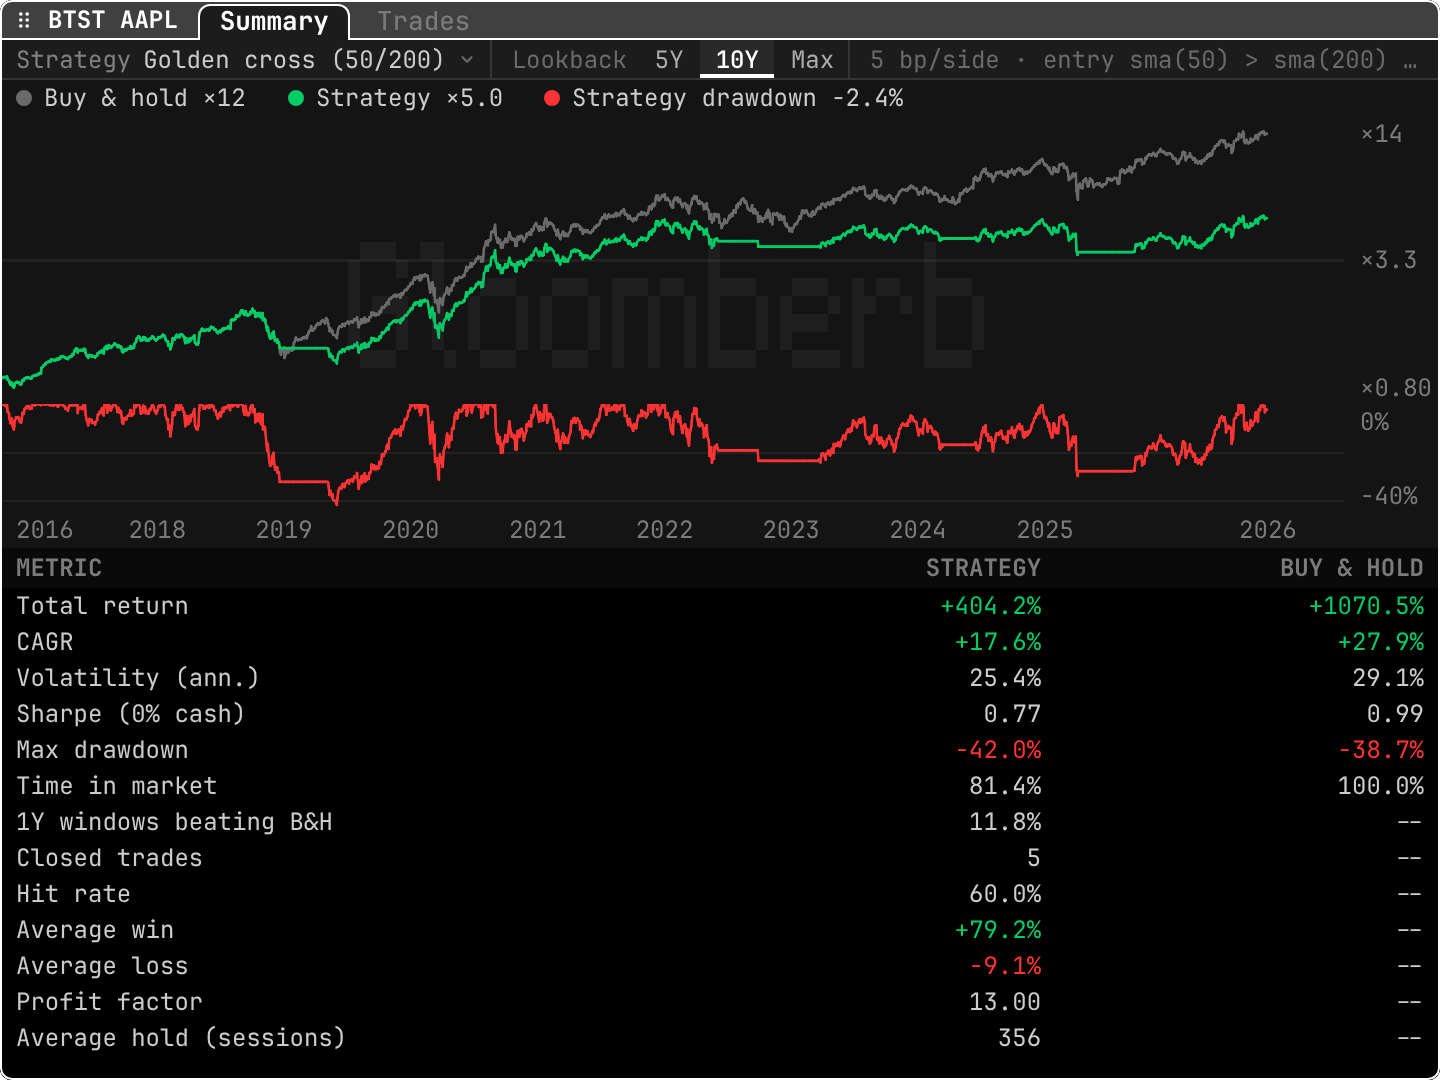
open ittype BT AAPL. s picks a strategy, e edits the rules, v switches between Summary and Trades.
- Top bar:
Golden cross (50/200),Lookback 10Y,5 bp/side, and the entry rulesma(50) > sma(200). - Legend:
Buy & hold ×12vsStrategy ×5.0. Holding multiplied the money by about 12; the rule by 5. CAGR +17.6%vs+27.9%: the rule lost by about 10 points a year.Max drawdown -42.0%vs-38.7%: being out of the market did not even protect this time.Closed trades 5,Hit rate 60.0%,Profit factor 13.00: three winners, two losers, one huge win. Too few trades to conclude much.1Y windows beating B&H 11.8%: the rule beat holding in only about one rolling year-long window out of eight.
Presets: golden cross, above the 200-day average, RSI reversion, MACD cross, Bollinger reversion, 55/20-day breakout. Or write your own, like close > sma(200) or rsi(14) < 30.
Practice and recap
Try it3 tasks
- From the scorecard: was the rule's ride smoother than buy-and-hold? (A bit: volatility 25.4% vs 29.1%, but a lower Sharpe, 0.77 vs 0.99.)
- Five trades with 60% hits: how many winners? (Three.)
- In the app, run the same rule on SPY with
BT SPYand compare. Does the verdict change?
Common mistakes4 mistakes
- Believing a rule because its total return is big. Compare with buy-and-hold.
- Ignoring the number of trades.
- Forgetting costs, or setting them to zero.
- Tweaking settings until the past looks perfect.
Check yourself3 questions
- What is buy-and-hold, and why is it the benchmark?
- What does a profit factor of 2 mean?
- Name three reasons a good backtest can fail in real life.
Answers
- Buying once and never selling; any rule must beat doing nothing to be worth it.
- Winning trades made twice as much in total as losing trades lost.
- Overfitting, too few trades, costs, a different future, one stock or period that was special.
Words in this lesson9 words
- backtest
- Replaying a rule on past data to see how it would have done.
- trading rule
- A recipe for when to be in or out, using past prices.
- buy-and-hold
- Buy once, never sell: the baseline.
- golden cross
- The 50-day average crossing above the 200-day average.
- long-only
- Owning or holding cash, never shorting.
- CAGR
- The steady yearly growth rate that gives the same total.
- hit rate
- Share of trades that made money.
- profit factor
- Gains of winners divided by losses of losers.
- overfitting
- Tuning a rule until it fits the past by luck.
Educational material about reading market data, not investment advice.