Portfolio risk (PORT, MARS)
PORT (also MARS) measures your portfolio's risk against a benchmark: how much it swings, its worst fall, a bad-day loss estimate, and what a crash or a rate jump would do to it.
- 5 min
- 3 questions
- Lesson 2 of 8
Why you would care
How much could this portfolio lose, and why? Your portfolio is up 18% in two months while the market is up 3%. Brilliant, or lucky and dangerous? Return alone does not answer that. You need to know how much risk produced the return, and what a bad day would look like.
The idea from scratch
Risk words from chapter 1 (volatility, drawdown, beta, correlation) now apply to your whole portfolio. A few new ones:
Benchmark
what you compare yourself with, usually a broad index fund like SPY.
Active return
your return minus the benchmark's. +15% active means you beat it by 15 percentage points.
Tracking error
how much your returns wander away from the benchmark's, as a yearly volatility. High tracking error means your portfolio looks nothing like the market: big wins or big losses relative to it.
VaR 95% (value at risk)
on a normal bad day, how much you could lose. "1-day VaR 95% = 1.3%" means: on 95 days out of 100, the daily loss should be smaller than 1.3%. The other 5 days are worse.
Expected shortfall
the average loss on those worst 5% of days. Never smaller than VaR.
Stress test
"what if" math. If the index falls 15%, if 10-year rates rise 1 point (100 basis points), if the VIX (the market's fear gauge) jumps 10 points, what happens to this portfolio?

See it in Gloom
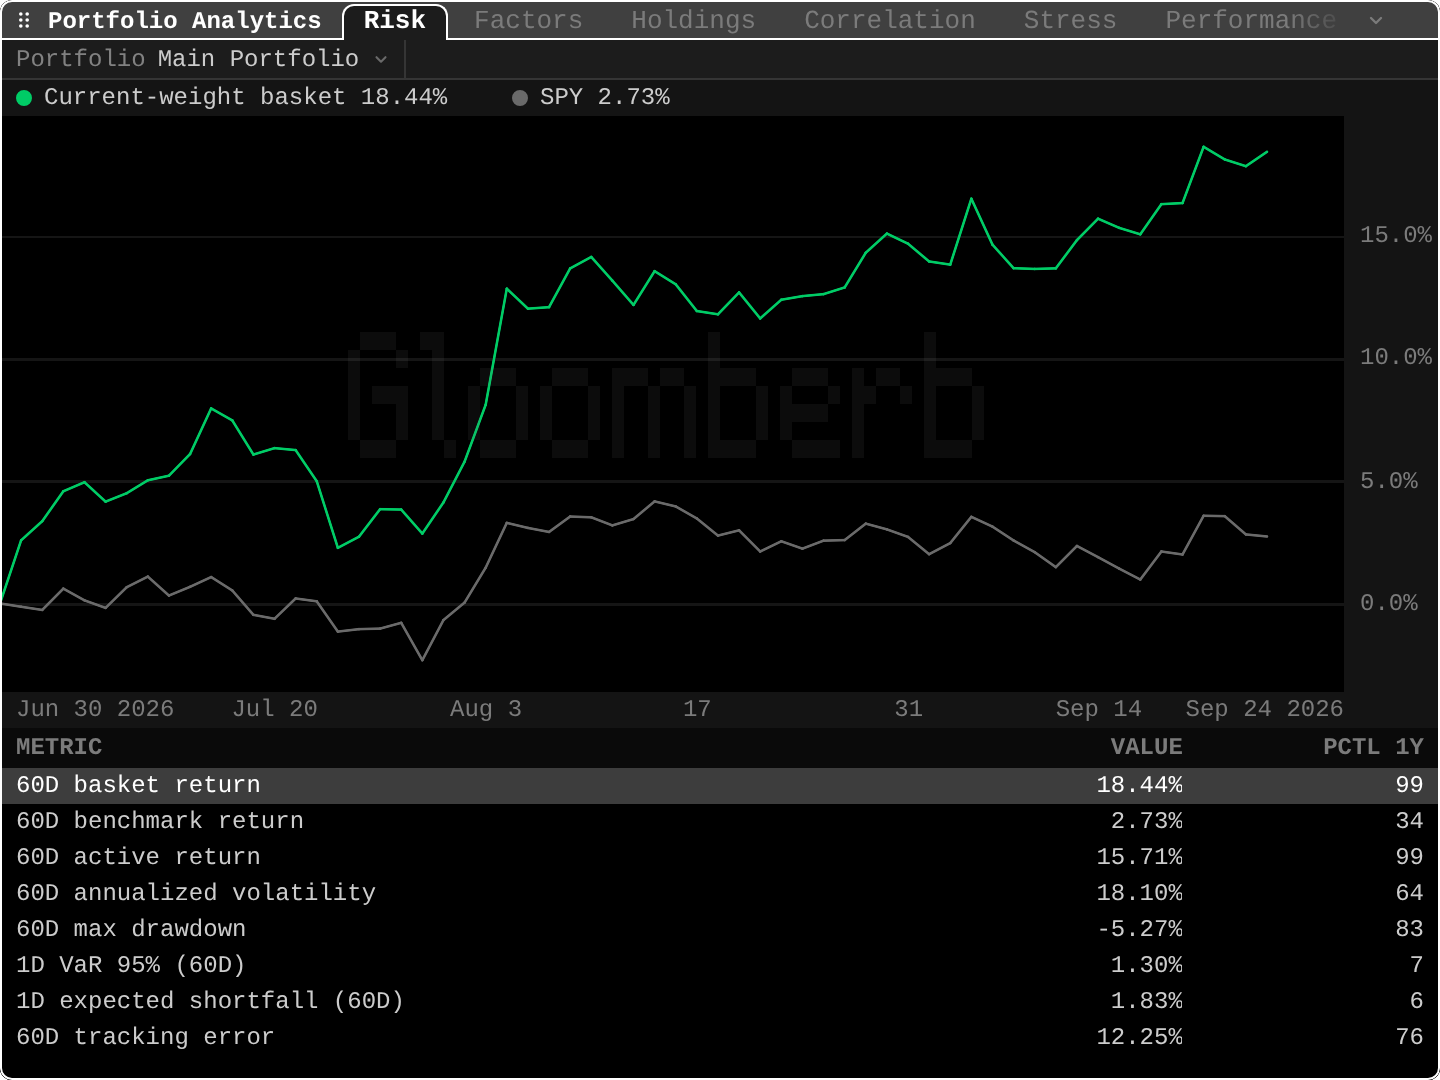
open ittype PORT (or MARS). p switches portfolio; h / l switch views.
Current-weight basket 18.44%vsSPY 2.73%: what today's holdings, at today's weights, would have returned over 60 days, against SPY. It is not your account's real return (you may have bought along the way).60D active return 15.71%: 18.44 - 2.73, the gap over the benchmark.60D annualized volatility 18.10%and60D max drawdown -5.27%: the swing size and the worst fall in the window.1D VaR 95% (60D) 1.30%and1D expected shortfall 1.83%: the bad-day and worst-days estimates.60D tracking error 12.25%: this portfolio drifts a lot away from SPY.PCTL 1Y: where each value sits in its own past year, from 0 (lowest) to 100 (highest). The 60-day return is at the 99th percentile: unusually high.
The other views: Factors (betas to market drivers), Holdings, Correlation (which positions move together), Stress (what-if shifts, set in the pane settings), Performance, Attribution and Greeks (the last three need you to import your own account data). Enter on a metric opens its history and how it was computed.
Practice and recap
Try it3 tasks
- From the screenshot: was this portfolio more or less volatile than its active return suggests? (18% volatility for an 18% two-month gain: a strong run with real risk.)
- A 50,000-dollar portfolio has a 1-day VaR 95% of 2%. What loss should it stay under on 19 days out of 20? (1,000 dollars.)
- Which number tells you how different your portfolio is from SPY? (Tracking error.)
Common mistakes4 mistakes
- Reading VaR as the maximum loss. It is the loss you exceed on the worst 5% of days, and those days can be much worse.
- Judging a portfolio by return without volatility or drawdown next to it.
- Treating 60 days as the whole story. Calm months make risk look small.
- Thinking the current-weight basket is your real performance.
Check yourself3 questions
- What does active return measure?
- VaR 95% is 1.5% and expected shortfall is 2.4%. What does 2.4% mean?
- What is a stress test?
Answers
- Your return minus the benchmark's return.
- On the worst 5% of days, the average loss is 2.4%.
- A "what if" calculation: the portfolio's change if the index, rates or volatility moved by a set amount.
Words in this lesson8 words
- benchmark
- What you compare your return with, often an index fund.
- active return
- Your return minus the benchmark's.
- tracking error
- How much your returns wander from the benchmark's, as a yearly volatility.
- VaR (value at risk)
- The loss you should stay under on most days (95% of them, here).
- expected shortfall
- The average loss on the days worse than VaR.
- stress test
- The portfolio's change under a chosen shock (index, rates, VIX).
- percentile
- Where a value ranks in its own history, from 0 to 100.
- factor beta
- How much the portfolio moves with one market driver.
Educational material about reading market data, not investment advice.