Sectors, themes and rotation (BI, THEM, RRG)
BI shows sector and industry performance, THEM curated themes as equal-weight baskets with breadth, and RRG plots each sector's strength and momentum against the market.
- 4 min
- 3 questions
- Lesson 2 of 6
Why you would care
Where is money flowing inside the market? "Tech is leading, utilities lag" or "money is rotating into energy" describe how investors shift between groups. A stock often moves with its group more than on its own news. Seeing group leadership tells you whether a move is about one company or a whole theme.
The idea from scratch
Sectors
A sector groups companies by business: technology, financials, energy, health care, utilities... The S&P 500 is split into 11 sectors, each tracked by an ETF (XLK technology, XLF financials, XLE energy...).
Themes
A theme is a story that cuts across sectors: "AI compute and data centers" includes chip makers, cloud companies and power suppliers. Gloom's themes are curated equal-weight baskets: each member counts the same, so one giant does not dominate.
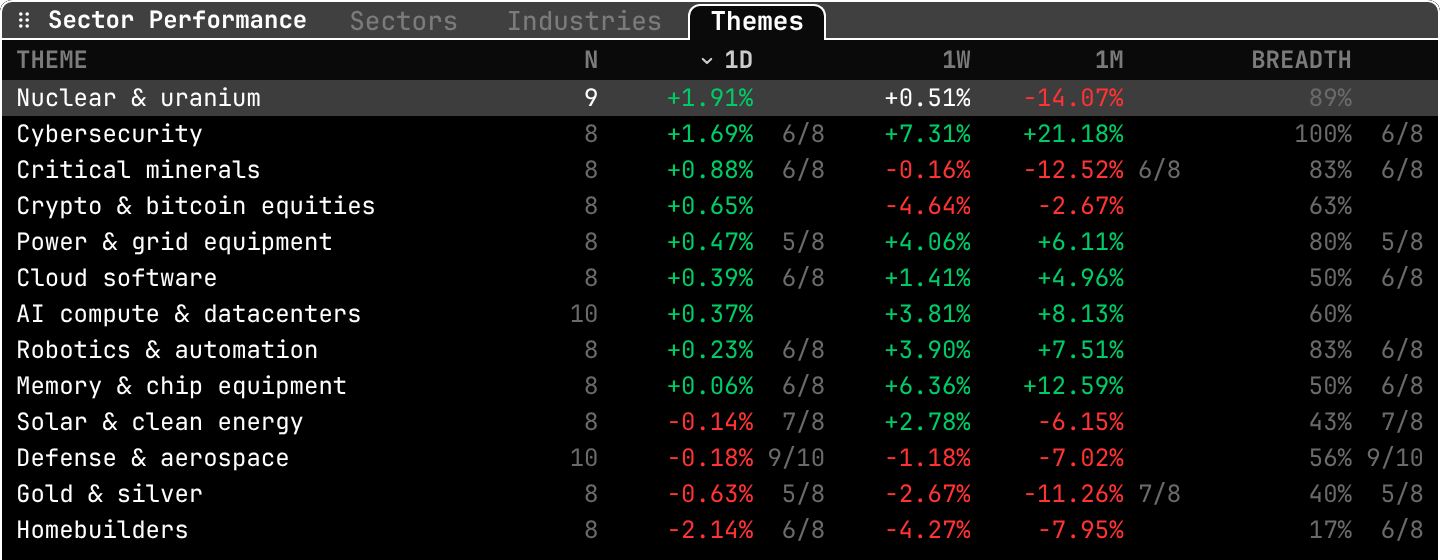
Breadth = the share of members that rose. A theme up 2% with 90% breadth is a broad move; up 2% with 30% breadth means a few names did the work.
Rotation
Relative strength compares a group's price with the market's (a ratio, scaled so 100 = in line). Momentum measures whether that relative strength is rising or falling. Together they place each group in a quadrant:
| Quadrant | Strength | Momentum | Meaning |
|---|---|---|---|
| Leading | above 100 | above 100 | Beating the market and accelerating |
| Weakening | above 100 | below 100 | Still ahead, losing steam |
| Lagging | below 100 | below 100 | Behind and falling further |
| Improving | below 100 | above 100 | Behind but catching up |
Groups tend to travel clockwise: improving, leading, weakening, lagging. The trail of weekly points shows the path.

See it in Gloom
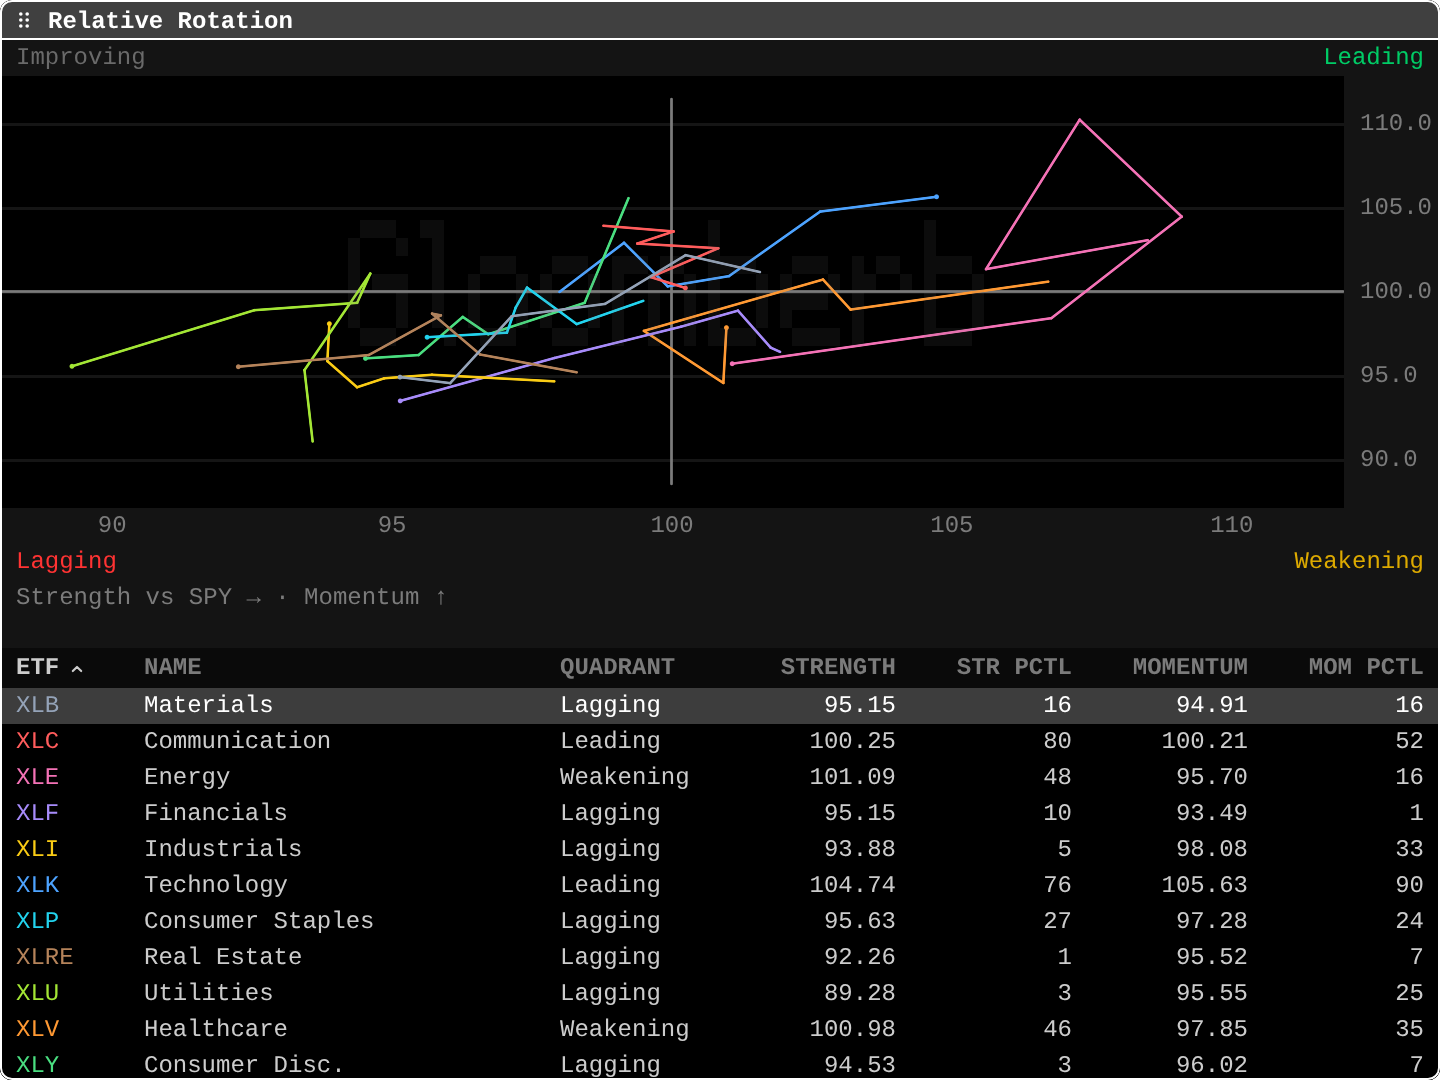
open themBI for sectors and industries (tabs Sectors and Industries; newer versions add a Themes tab), THEM for themes (in newer versions it opens that Themes tab), RRG for rotation.
- RRG quadrants:
Leadingtop right,Weakeningbottom right,Laggingbottom left,Improvingtop left. XLK Technology Leading 104.74 105.63: tech beats the market and accelerates.XLE Energy Weakening 101.09 95.70: still ahead, losing momentum.XLRE Real Estate Lagging 92.26,STR PCTL 1: the weakest relative strength of its past year.
- In THEM:
Cybersecurity +1.69% ... +21.18% (1M) breadth 100%: every member rose that day. Homebuilders -2.14% breadth 17%: a broad decline.
Practice and recap
Try it3 tasks
- In RRG, which sectors are leading? (Communication XLC and Technology XLK.)
- A theme is up 1% with breadth 25%. Broad or narrow? (Narrow: a few members did the work.)
- Utilities lagging at strength 89.28: is it beating or trailing the market? (Trailing.)
Common mistakes4 mistakes
- Treating the clockwise cycle as a rule; groups can jump quadrants.
- Ignoring breadth.
- Comparing an equal-weight theme with a market-cap index without noticing the weighting difference.
- Chasing the "leading" quadrant after the move.
Check yourself3 questions
- What does breadth measure?
- What does the Improving quadrant mean?
- Why use equal-weight baskets for themes?
Answers
- The share of a group's members that rose.
- Weaker than the market but gaining relative momentum.
- So that one very large company does not dominate the theme's return.
Words in this lesson7 words
- sector
- A group of companies in the same kind of business.
- theme
- A story that cuts across sectors, tracked by a basket.
- equal-weight basket
- Each member counts the same.
- breadth
- The share of members that rose.
- relative strength
- A group's performance compared with the market.
- momentum (relative)
- Whether relative strength is rising or falling.
- rotation
- Money moving from one group to another.
Educational material about reading market data, not investment advice.