The three financial statements (FA)
Every company reports three tables (the income statement, the balance sheet and the cash flow statement), and FA shows all three by year or quarter.
- 5 min
- 3 questions
- Lesson 1 of 5
Why you would care
Is this a good business, in numbers? "Microsoft earned 134 billion last year." Earned how? On how much in sales? Did that profit arrive as cash, or is it stuck in unpaid bills? The three statements answer those questions. Every ratio, screen and valuation in the rest of this chapter is built on them.
The idea from scratch
Meet Lemonade Co., a tiny fictional company (illustrative numbers, in thousands of dollars).
1. The income statement: one period, top to bottom
It starts with sales and subtracts costs, layer by layer:
| Line | Lemonade Co. | Meaning |
|---|---|---|
| Revenue | 1,000 | Everything sold this year |
| Cost of revenue | -400 | Lemons, sugar, cups: costs that grow with each sale |
| Gross profit | 600 | What is left to pay for everything else |
| Operating expenses | -350 | Salaries, rent, marketing, research (R&D, SG&A) |
| Operating income | 250 | Profit from running the business |
| Interest | -20 | The cost of its loans |
| Tax | -50 | |
| Net income | 180 | The bottom line: profit for shareholders |
Divide net income by the number of shares and you get EPS (earnings per share). With 100 shares, EPS = 1.80.
2. The balance sheet: one date, two sides that match
| Owns (assets) | Owes and belongs to owners | ||
|---|---|---|---|
| Cash | 300 | Bills to pay (payables) | 100 |
| Money customers owe (receivables) | 100 | Loans (debt) | 300 |
| Stock of lemons (inventory) | 100 | Equity (what belongs to shareholders) | 600 |
| Stands and juicers (equipment) | 500 | ||
| Total assets | 1,000 | Total | 1,000 |
The rule that never breaks: assets = liabilities + equity. Liabilities are everything owed; equity is what would be left for shareholders if everything were sold and every debt paid.
3. The cash flow statement: profit is not cash
Profit counts sales when made, even if not yet paid. Cash flow counts money when it moves.
| Section | Lemonade Co. | Meaning |
|---|---|---|
| Operating cash flow | +210 | Net income 180, plus depreciation 50 (a cost that used no cash this year), minus 20 more owed by customers |
| Investing | -120 | New juicers: this spending is capex (capital expenditure) |
| Financing | -60 | Dividends paid 40, loan repaid 20 |
| Change in cash | +30 |
Free cash flow (FCF) = operating cash flow - capex = 210 - 120 = 90. The cash the business throws off after keeping itself running. Many investors trust it more than net income.

See it in Gloom
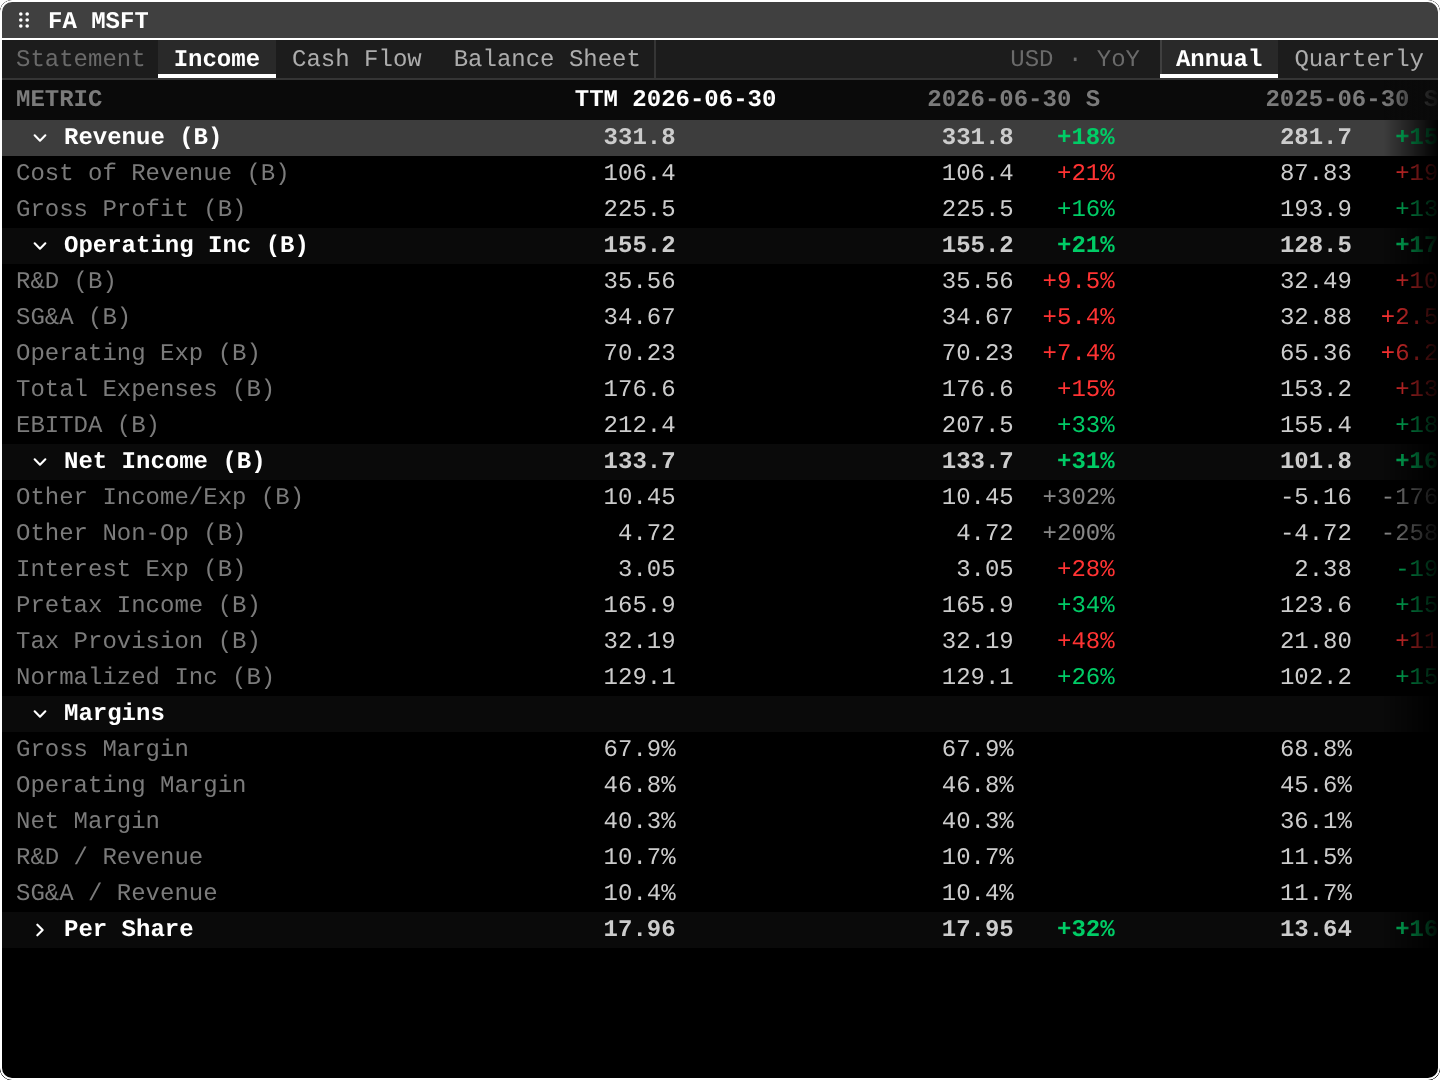
open ittype FA MSFT. Tabs Income, Cash Flow, Balance Sheet on top; Annual / Quarterly on the right (p switches).
- Columns:
TTM 2026-06-30(trailing twelve months: the last four quarters added up) and fiscal years ending June 30 (Microsoft's fiscal year ends in June). Revenue (B) 331.8 +18%: 331.8 billion dollars of sales, up 18% on the year before (the YoY change).Gross Profit 225.5,Operating Inc 155.2,Net Income 133.7: the layers of the table above.Margins:Gross 67.9%,Operating 46.8%,Net 40.3%. Each layer as a share of revenue. Microsoft keeps 40 cents of profit per dollar of sales.Per Share 17.95: earnings per share for the year.eexpands every group,ccollapses them; the arrows on the left open one group.
Practice and recap
Try it3 tasks
- Lemonade Co.'s gross margin and net margin? (600 / 1,000 = 60%; 180 / 1,000 = 18%.)
- In the screenshot, how much did Microsoft spend on R&D, and what share of revenue is that? (35.56 billion, 10.7%.)
- Check the balance sheet rule for Lemonade Co.: 100 + 300 + 600 = 1,000. Yes.
Common mistakes4 mistakes
- Treating net income as cash. Check operating cash flow and free cash flow.
- Comparing a quarter with a full year. Use the same period type, or TTM.
- Forgetting fiscal years: Microsoft's "2026" ended in June 2026.
- Reading equity as the company's market value. Equity is an accounting number; market cap is price x shares.
Check yourself3 questions
- Which statement answers "what does the company owe right now"?
- Net income 50, depreciation 10, capex 30, nothing else changes. Free cash flow?
- What is TTM?
Answers
- The balance sheet (liabilities).
- Operating cash flow 60 (50 + 10), minus capex 30 = 30.
- Trailing twelve months: the last four quarters added up.
Words in this lesson11 words
- income statement
- Revenue minus costs over a period.
- gross profit / operating income / net income
- Profit after direct costs / after running costs / after everything.
- EPS
- Net income divided by the number of shares.
- balance sheet
- What a company owns (assets) and owes (liabilities) on one date, and the owners' share (equity).
- equity
- Assets minus liabilities: the shareholders' part.
- cash flow statement
- Where cash came from and went: operating, investing, financing.
- capex
- Money spent on long-lasting things like equipment.
- depreciation
- Spreading the cost of equipment over its useful years.
- free cash flow (FCF)
- Operating cash flow minus capex.
- TTM
- Trailing twelve months.
- YoY
- Year over year: compared with the same period a year earlier.
Educational material about reading market data, not investment advice.