Make it yours (VIEW, PL, TH, LANG, FONT, SB, VF, CR)
VIEW builds your own table from any data function, PL manages plugins, and a few short commands change the theme, language, font size and visual effects.
- 4 min
- 3 questions
- Lesson 9 of 9
Why you would care
How do you make the screen show exactly what you want? Every trader's screen ends up different. One wants a table of "stocks trading three times their usual volume". Another wants a light theme on a sunny desk, or the interface in Japanese. None of that needs code. It needs about eight short commands.
The idea from scratch
VIEW: your own table
Many functions are tables: movers (MOST), peers (RV), the screener. A custom view takes the rows of one of those functions and lets you choose:
- the source (which function's rows),
- the columns (which fields to show),
- a filter (which rows to keep),
- the sort (which column decides the order),
- a title.
You describe this in a small spec (a short JSON text). You do not have to write it yourself: Ask Gloom can write it from a sentence, or you paste one. The view is as fresh as the function it reads.
- Source: MOST, most active stocks
- Pick columns: symbol, name, last, change, volume vs average
- Filter: optional
- Sort: volume vs average, highest first
- Your view: 'Unusual volume'
PL: plugins
A plugin is an add-on that brings new functions. Some come with Gloom and can be switched off; others are official add-ons you install (TV, polls, prediction markets, Hacker News, newsletters, broker connections). In PL: i install, e enable or disable, s setup, / search, b shows the built-in modules. You can also just type an official plugin's code, like TV: the command bar offers to install it after a confirmation.
The small switches
| Command | What it does |
|---|---|
TH or TH amber | Change the color theme, light or dark, with a live preview |
LANG ja (or en, es, zh-CN, zh-TW, ko, auto) | Change the interface language |
FONT+ / FONT- | Bigger or smaller text (desktop) |
SB | Show or hide the keyboard shortcuts bar at the bottom |
VF | Turn the flash on price changes on or off |
CR | In the terminal, cycle how charts are drawn (Auto, Kitty graphics, Braille) |
See it in Gloom
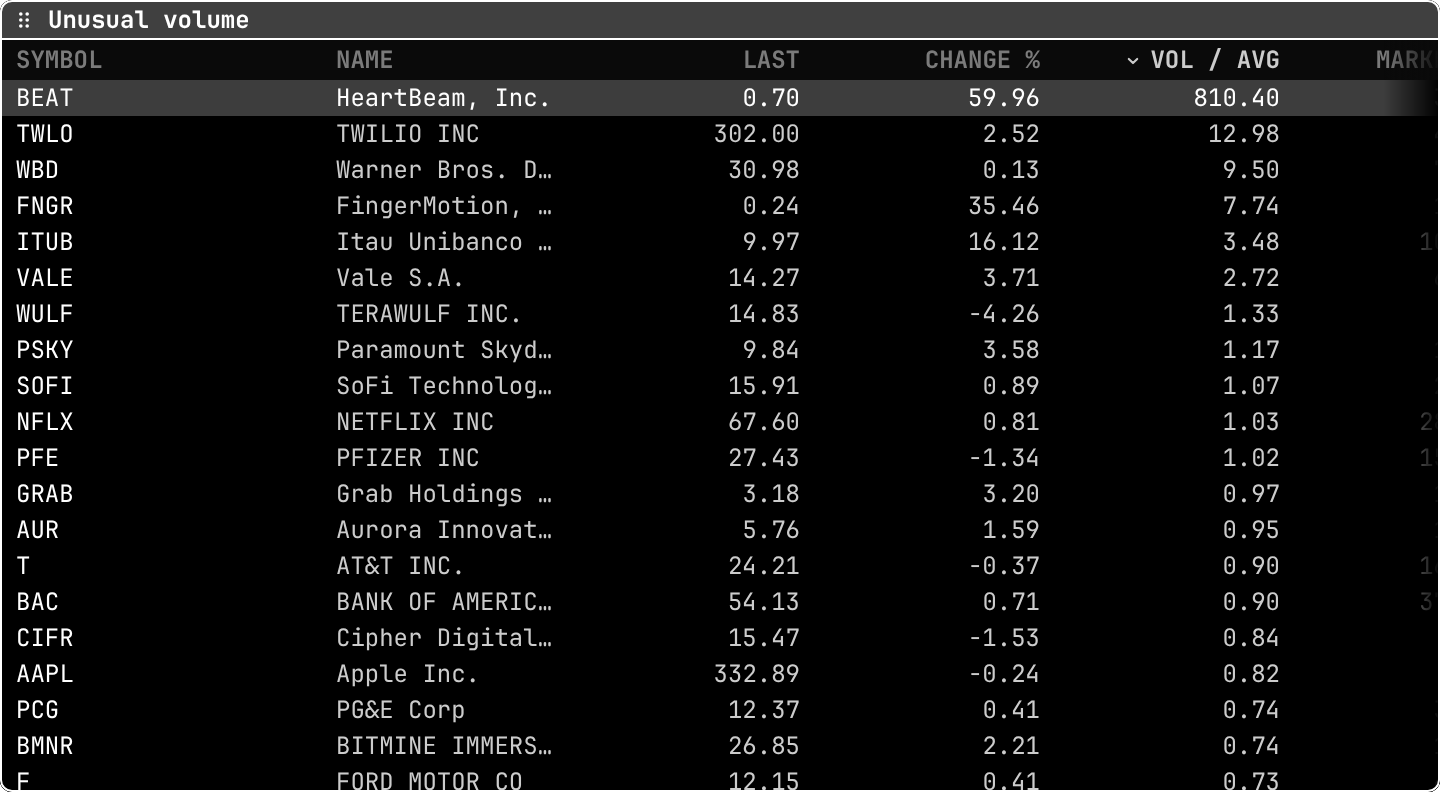
open ittype VIEW and paste a spec, or ask Ask Gloom for "a view of the most active stocks sorted by volume against average".
- The title,
Unusual volume: the name in the spec. - The columns:
SYMBOL,NAME,LAST,CHANGE %,VOL / AVG. Chosen in the spec, from the fields the source offers. - The arrow next to
VOL / AVG: the sort column, highest first. - The top row:
BEATtraded 810 times its average volume, with a +59.96% move. A tiny stock with unusual news. - Lower rows:
AAPLat 0.82 traded a bit less than usual that day.
Enter opens the selected ticker; t publishes the view to your team.
Practice and recap
Try it3 tasks
- In the screenshot, how many rows traded more than twice their average volume? (Six: BEAT, TWLO, WBD, FNGR, ITUB, VALE.)
- Write, in plain words, a view you would like: source, columns, sort.
- In the app, type
THand try two themes. ThenSBtwice.
Common mistakes4 mistakes
- Building a view from a source that does not have the column you want. The columns come from the source function.
- Forgetting that a view inherits its source's freshness: a view of a delayed list is delayed.
- Installing every plugin. Install what you will use;
PLcan switch the others off. - Changing
LANGand losing your way:LANG enbrings English back.
Check yourself3 questions
- What four choices define a custom view, besides the title?
- How do you install the TV plugin without opening
PL? - Which command turns the price flash off?
Answers
- The source, the columns, the filter and the sort.
- Type
TVin the command bar and confirm the install. VF.
Words in this lesson5 words
- custom view
- Your own table built from another function's rows.
- spec
- The short text (JSON) that describes a custom view.
- plugin
- An add-on that brings new functions to Gloom.
- theme
- The color scheme of the app.
- volume vs average
- Today's volume divided by the usual volume; above 1 means busier than usual.
Educational material about reading market data, not investment advice.