Understanding risk
Four numbers describe how much an investment can hurt: volatility (how bumpy), drawdown (how deep the worst fall), correlation (do two things move together) and beta (how much it moves with the market).
- 7 min
- 3 questions
- Lesson 3 of 3
Why you would care
How much can this hurt, and does owning two things help? Two funds both made 10% a year. One got there smoothly; the other fell 40% on the way. Same return, very different experience, and many people sell at the bottom of that 40% hole. Risk numbers let you see the ride, not just the destination.
The idea from scratch
Everything here starts from a list of daily returns: each day's percent change, close to close (Returns and percentages).

Volatility: how bumpy
Two kids walk to school and arrive at the same time. One walks straight; the other zigzags across the road. Same result, very different path.
Volatility is the size of a typical move, measured as the standard deviation of returns (a standard way to compute "typical distance from the average"). It counts up moves and down moves the same: it measures bumpiness, not direction.
It is usually annualized, shown per year. Rough rule: multiply a daily volatility by 16 (about the square root of the 252 trading days in a year). A stock that typically moves 1% a day has a volatility of about 16% a year.
Drawdown: how deep the hole
A drawdown is the fall from the highest point reached so far. The max drawdown is the worst one over a period.
Remember Returns and percentages: a -40% hole needs +67% to climb out.
Correlation: do they move together
Correlation is a number from -1 to +1 that says how consistently two things move in the same direction.
+1
always the same direction.
0
no relationship.
-1
always opposite. Think of an umbrella seller and a sunscreen seller.
This is what makes diversification work: owning things with low correlation means they do not all fall on the same day. Correlation says nothing about the size of the moves, only the direction.
Beta: how much it moves with the market
Beta answers: "when the market moves 1%, how much does this stock tend to move?" The market is usually an index such as the S&P 500.
- Beta 1: moves like the market, on average.
- Beta 2: about twice as much. Beta 0.5: about half. Negative: tends to move the other way.
Go deeper: how beta, correlation and volatility connect
Beta is not volatility and not correlation; it mixes both: beta = correlation x (stock volatility / market volatility). A wild stock with low correlation can have a low beta. Illustrative: correlation 0.5, stock volatility 40%, market volatility 20%: beta = 0.5 x 2 = 1.0.
See it in Gloom
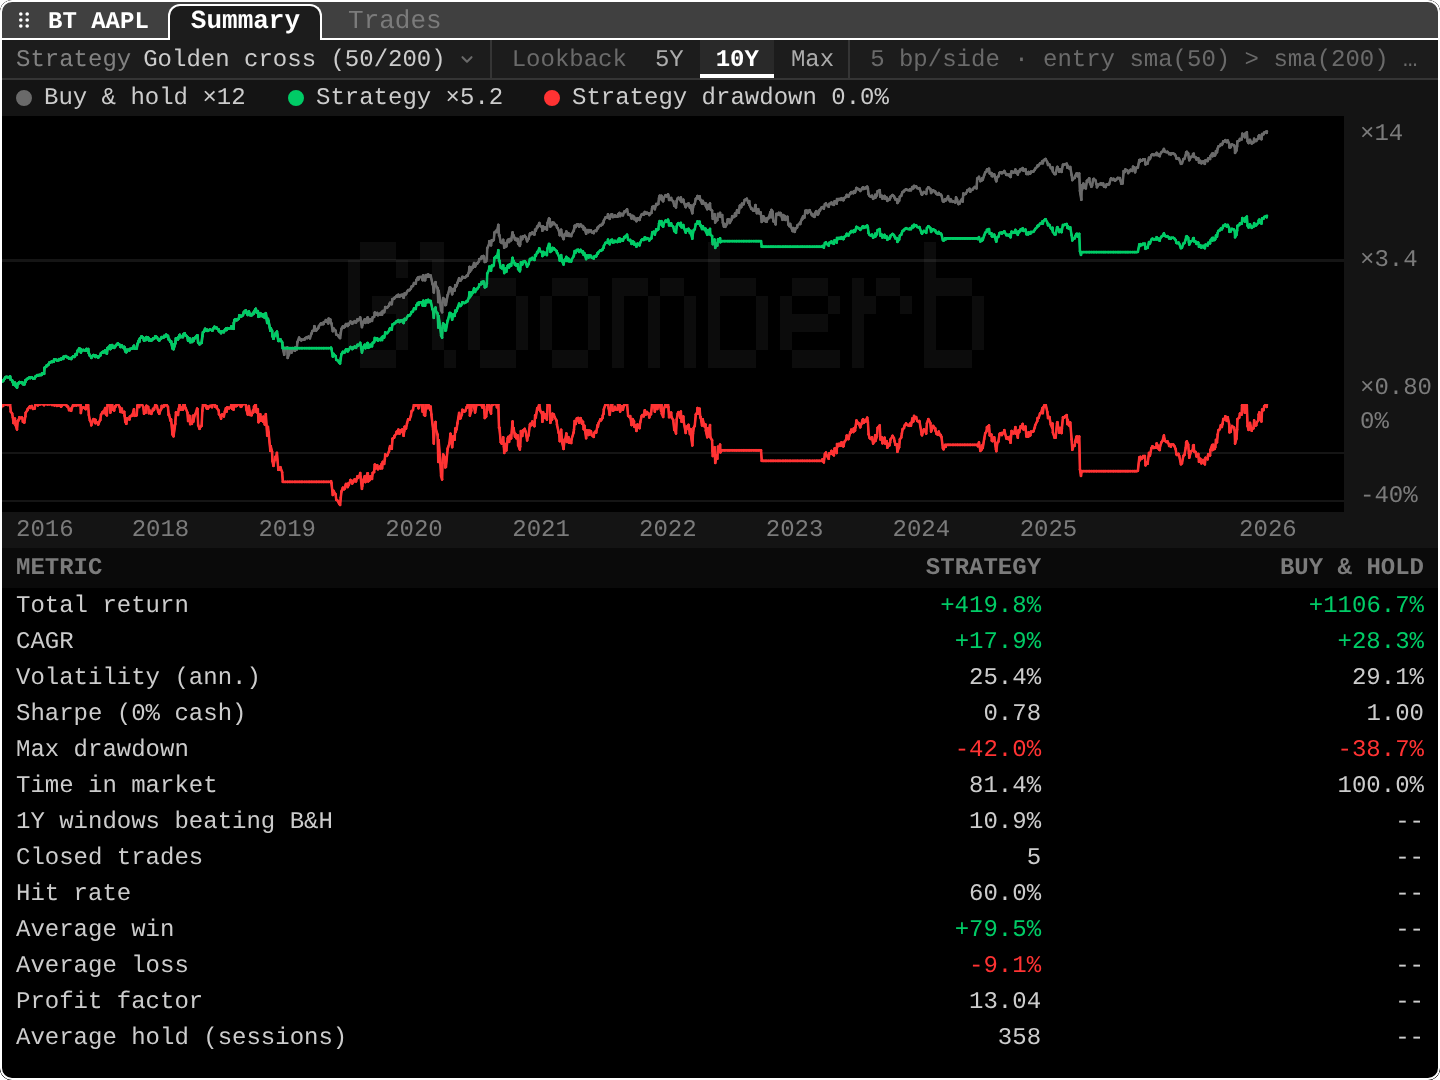
open ittype BT AAPL. (Backtests are taught in chapter One company and its price; here we only read the risk rows.)
Total return +1106.7%andCAGR +28.3%for buy and hold: the same ten years, said two ways (Returns and percentages).Volatility (ann.) 29.1%: a typical year swings about 29%. Divide by 16: a typical day moves about 1.8%.Max drawdown -38.7%: even a stock that rose about twelvefold had a moment when holders were almost 39% below the peak.- The red line: 0% means "at a new high"; dips show how deep each hole was and how long it lasted.
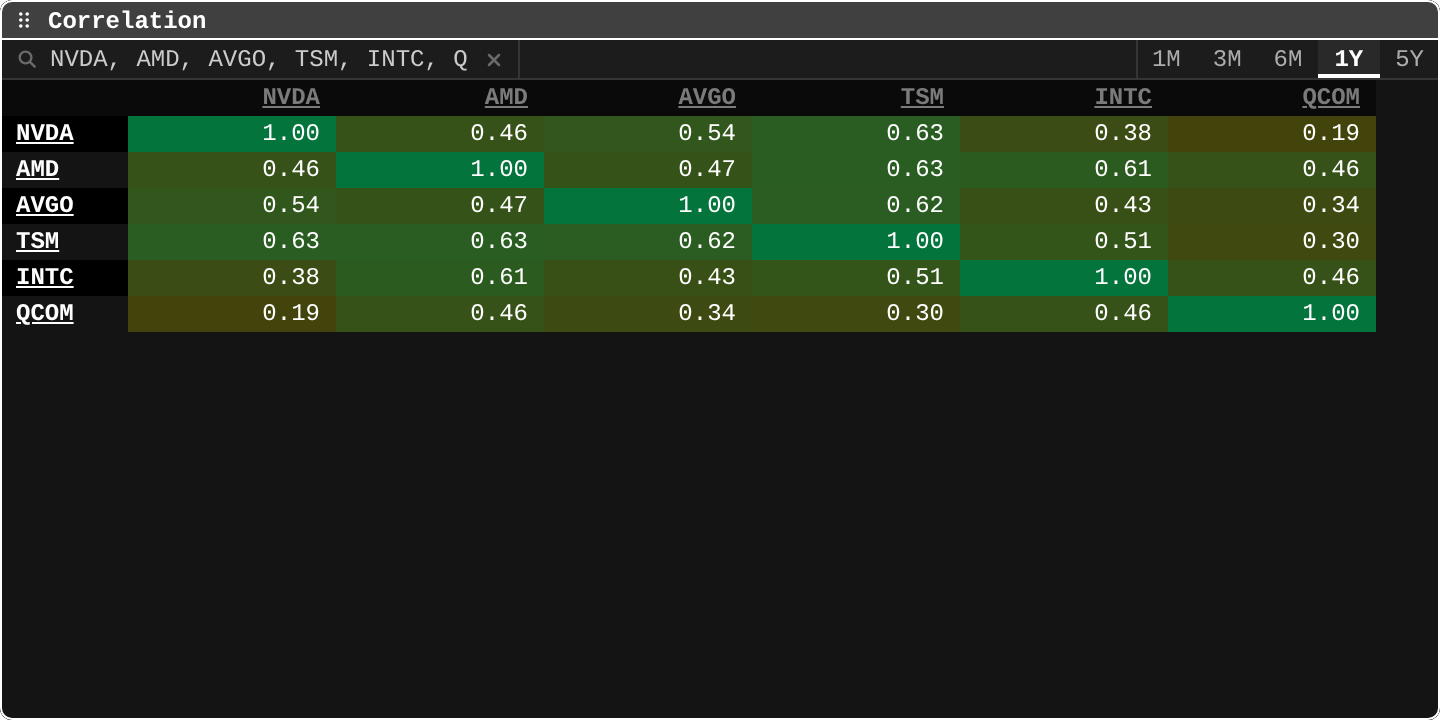
open ittype CORR NVDA, AMD, AVGO, TSM, INTC, QCOM. (Taught in chapter 05, Compare, screen and follow the money.) It uses daily closes.
1.00on the diagonal: a stock always matches itself.NVDAwithTSM: 0.63, they often move together.NVDAwithQCOM: 0.19, much weaker. Same industry does not mean high correlation.- Beta lives elsewhere: the two-ticker comparison
GRand the portfolio risk view show it (chapter 05 and chapter 02).
Practice and recap
Try it3 tasks
- Using the backtest screenshot: which of the two columns had the higher volatility, and which the deeper max drawdown? (Buy and hold had higher volatility, 29.1% vs 25.4%; the strategy had the deeper drawdown, -42.0% vs -38.7%. The two measures do not always agree.)
- In the matrix, find the least correlated pair. (NVDA and QCOM, 0.19.)
- A stock has a beta of 1.5. The index falls 2% today. What would you roughly expect? (About -3%, on average. Any single day can differ.)
Common mistakes4 mistakes
- Reading volatility as "risk of falling". It counts rises too.
- Thinking correlation of 0.6 means "moves 60% as much". It is about direction, not size; size is beta's job.
- Treating beta or correlation as fixed. Both change over time, and in a crash many correlations jump toward 1.
- Ignoring drawdown because the total return looks great.
Check yourself3 questions
- Prices go 50, 80, 60, 90. What is the max drawdown?
- A stock moves about 2% on a typical day. Roughly what is its annualized volatility?
- Two assets have a correlation of -0.8. Do they help diversify each other?
Answers
- From 80 to 60: (60 - 80) / 80 = -25%.
- About 2% x 16 = 32% a year.
- Yes, strongly: they tend to move in opposite directions.
Go deeper: the Sharpe ratio
The backtest table also shows Sharpe (0% cash). The Sharpe ratio is return above a safe cash rate divided by volatility: how much reward per unit of bumpiness. With cash assumed to pay 0%, buy and hold had 1.00. Higher means a smoother ride for the same return.
Words in this lesson11 words
- risk
- How much, and how badly, results can differ from what you hoped.
- daily return
- One day's percent change, close to close.
- volatility
- The size of a typical move, as the standard deviation of returns, usually per year.
- standard deviation
- A standard way to compute the typical distance of numbers from their average.
- annualized
- Converted to a per-year figure.
- drawdown
- The fall from the highest point reached so far.
- max drawdown
- The worst drawdown over a period.
- correlation
- A number from -1 to +1: how often two things move in the same direction.
- diversification
- Owning things that do not all fall together.
- beta
- How much a stock tends to move for each 1% move of the market.
- Sharpe ratio
- Return above cash divided by volatility.
Educational material about reading market data, not investment advice.