Ratios that matter (FA ratio tabs)
A ratio divides one number by another so companies of any size can be compared: margins and returns for quality, debt ratios for risk, and valuation multiples for price.
- 6 min
- 3 questions
- Lesson 2 of 5
Why you would care
"NVDA trades at 30 times earnings." Is that a lot? Compared with what? And why does Apple show a return on equity of 171%? Ratios are the shared language of analysts. Knowing what each one divides, and where it breaks, keeps you from the classic traps.
The idea from scratch
We continue with Lemonade Co. from the last lesson: revenue 1,000, operating income 250, net income 180, depreciation 50, debt 300, cash 300, equity 600 (550 a year earlier), free cash flow 90, 100 shares at 27 dollars (illustrative).
How good is the business?
| Ratio | Formula | Lemonade Co. |
|---|---|---|
| Net margin | Net income / revenue | 180 / 1,000 = 18% |
| ROE (return on equity) | Net income / average equity | 180 / 575 = 31% |
| ROA (return on assets) | Net income / average total assets | how much profit per dollar of stuff owned |
| ROIC (return on invested capital) | After-tax operating profit / (equity + debt) | the return on all the money put in, by owners and lenders |
How risky is it?
| Ratio | Formula | Meaning |
|---|---|---|
| Debt / equity | Debt / equity | 300 / 600 = 0.5 |
| Net debt / EBITDA | (Debt - cash) / EBITDA | roughly how many years of EBITDA it would take to cover net debt (a gauge, not a repayment plan); here 0 |
| Interest coverage | Operating income / interest | 250 / 20 = 12.5 times |
| Current ratio | Current assets / current liabilities | can it pay the next year's bills? |
EBITDA is earnings before interest, taxes, depreciation and amortization: operating income plus the non-cash costs, 250 + 50 = 300. A rough measure of cash profit before financing.
How expensive is the stock?
- Market cap = price x shares = 27 x 100 = 2,700.
- P/E (price / earnings) = price / EPS = 27 / 1.80 = 15. You pay 15 dollars for each dollar of this year's profit. It is not a promise to get your money back in 15 years: profits grow, shrink, and are not all paid out.
- EV (enterprise value) = market cap + debt - cash = 2,700 + 300 - 300 = 2,700. The price of the whole business, debts included.
- EV / EBITDA = 2,700 / 300 = 9. Comparable across companies with different debt.
- P/S (price / sales) = 2,700 / 1,000 = 2.7. Useful when there is no profit yet.
- P/B (price / book) = 2,700 / 600 = 4.5. Book value is equity.
- FCF yield = free cash flow / market cap = 90 / 2,700 = 3.3%. Like an interest rate on the business.

Where ratios mislead
- P/E with a loss means nothing: Gloom shows
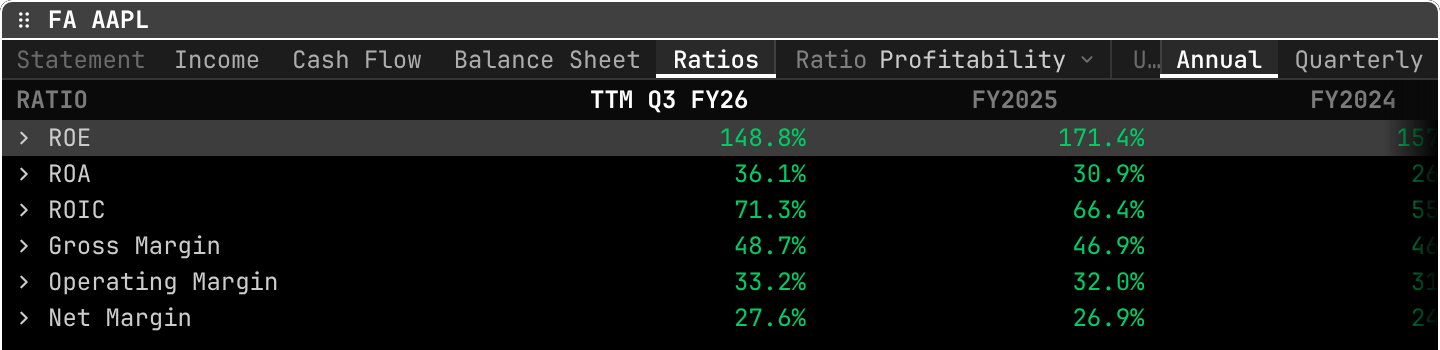
N/M(not meaningful). - Tiny equity inflates ROE. Companies that buy back many shares shrink their equity. Apple's ROE was 171% in FY2025: not magic, a small denominator. Gloom shows
N/Mwhen equity is zero or negative at either end, or ROE is beyond ±500%. - One-offs (a big tax gain, an asset sale) make one year's P/E look cheap.
- Cycles: a steel maker at peak profit has a low P/E right before profits fall.
See it in Gloom
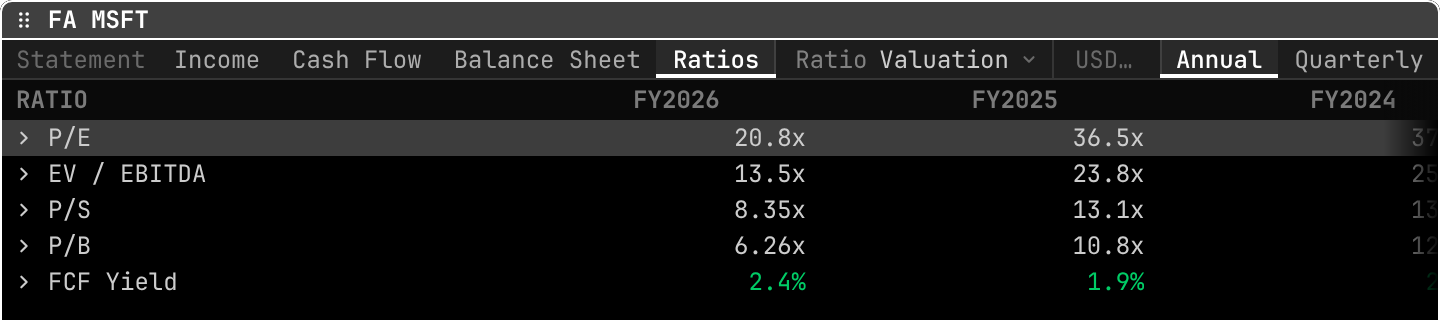
open ittype FA MSFT, then pick Ratios in the Statement bar and a ratio tab (Profitability, Leverage, Liquidity, Efficiency, Valuation). Keys 1 to 8 jump between statements and ratio tabs.
P/E 20.8xfor FY2026 against36.5xfor FY2025: the multiple fell although earnings per share grew 32% (13.64 to 17.95 dollars). Why? Each year is priced at its own period end, and the share closed June 2026 near 373 dollars, after a sharp fall that month, against about 497 a year earlier.EV / EBITDA 13.5x: the whole business, debt included, costs 13.5 times one year of EBITDA.P/S 8.35xandP/B 6.26x.FCF Yield 2.4%: green, because the sign is positive.Enteron a ratio (orefor all) opens its inputs, written like a formula:Net Income, then÷ Avg Equity.
Practice and recap
Try it3 tasks
- Lemonade Co. at 40 dollars a share: new P/E? (40 / 1.80 = 22.)
- Which of MSFT's FY2026 numbers would you quote to say "the market charges about 21 times profit"? (P/E 20.8x.)
- Apple: why can ROE be 171%? (Equity is small after years of buybacks, so a normal profit divided by it gives a huge ratio.)
Common mistakes4 mistakes
- Comparing P/E across industries with very different growth or cycles.
- Reading high ROE as quality without looking at equity.
- Using P/E for a company with losses. Use P/S or EV/EBITDA, carefully.
- Mixing a ratio at today's price with one at a past period end.
Check yourself3 questions
- What does EV add to market cap, and why?
- FCF 50, market cap 1,000. FCF yield?
- What does
N/Mmean in a ratio cell?
Answers
- Debt, minus cash: buying the whole business means taking on its debts and getting its cash.
- 5%.
- Not meaningful: the denominator is zero or negative (a loss, negative equity...), so the ratio says nothing.
Words in this lesson11 words
- ratio
- One number divided by another, for comparison.
- ROE / ROA / ROIC
- Profit over equity / over assets / over all invested capital.
- EBITDA
- Earnings before interest, taxes, depreciation and amortization.
- market cap
- Share price x number of shares.
- P/E
- Price divided by earnings per share.
- enterprise value (EV)
- Market cap + debt - cash: the price of the whole business.
- EV / EBITDA
- Enterprise value divided by EBITDA.
- P/S, P/B
- Price over sales; price over book value (equity).
- FCF yield
- Free cash flow divided by market cap.
- N/M
- Not meaningful: the ratio cannot be read.
- buyback
- A company buying its own shares, shrinking the share count and equity.
Educational material about reading market data, not investment advice.