VWAP, bands, ATR and price levels (chart tools)
VWAP, Bollinger Bands, ATR, volume profile and your own price levels are different ways of asking whether today's price is normal, and a level can become an alert.
- 5 min
- 3 questions
- Lesson 4 of 5
Why you would care
A trader says "it's holding VWAP" or "that's two standard deviations out" or "my stop is one ATR below". Each phrase points at a line you can draw in Gloom. Each one is a different way of asking "is this price normal?"
The idea from scratch
VWAP: the average price people actually paid
VWAP (volume-weighted average price) is the average price of the day's trades, where big trades count more than small ones.
Illustrative: 100 shares at $10, 100 at $11, 300 at $12.
- Plain average of the prices: (10 + 11 + 12) / 3 = $11.00.
- VWAP: (100×10 + 100×11 + 300×12) / 500 shares = 5,700 / 500 = $11.40. Most shares changed hands at $12, so VWAP leans there.
Big funds often judge their own buying against VWAP: "did I pay more or less than the average buyer today?"
In Gloom, VWAP uses each bar's typical price, (high + low + close) / 3, weighted by the bar's volume, and restarts at each session open: 9:30 am New York for US listings. So it needs intraday bars (use GIP). Anchored VWAP runs the same average from a bar you pick, say an earnings day, and never restarts.
Bollinger Bands: a normal range
Take the 20-bar SMA. Measure how far closes usually stray from it: that typical distance is the standard deviation. Draw a line 2 standard deviations above the average and one 2 below. Those are Bollinger Bands.
Calm market: narrow bands. Wild market: wide bands. A close outside a band is unusual for that stock's recent behaviour, not a signal by itself.
ATR: how far a bar usually travels
A bar's true range is the largest of three distances: high minus low, high minus the previous close, and the previous close minus the low. It counts overnight gaps.
Illustrative: previous close $100, today high $104, low $101. High minus low is $3, but the jump from $100 to $104 is $4. True range = $4.
ATR (average true range) averages that over 14 bars. "ATR is $4" means a typical bar covers about $4.
Volume profile: where the shares traded
Turn the volume bars sideways: instead of "how many shares per day", it shows "how many shares at each price" across the bars in view. The busiest price row is the point of control, drawn as a dotted level. The value area is the band around it holding 70% of the volume.
See it in Gloom
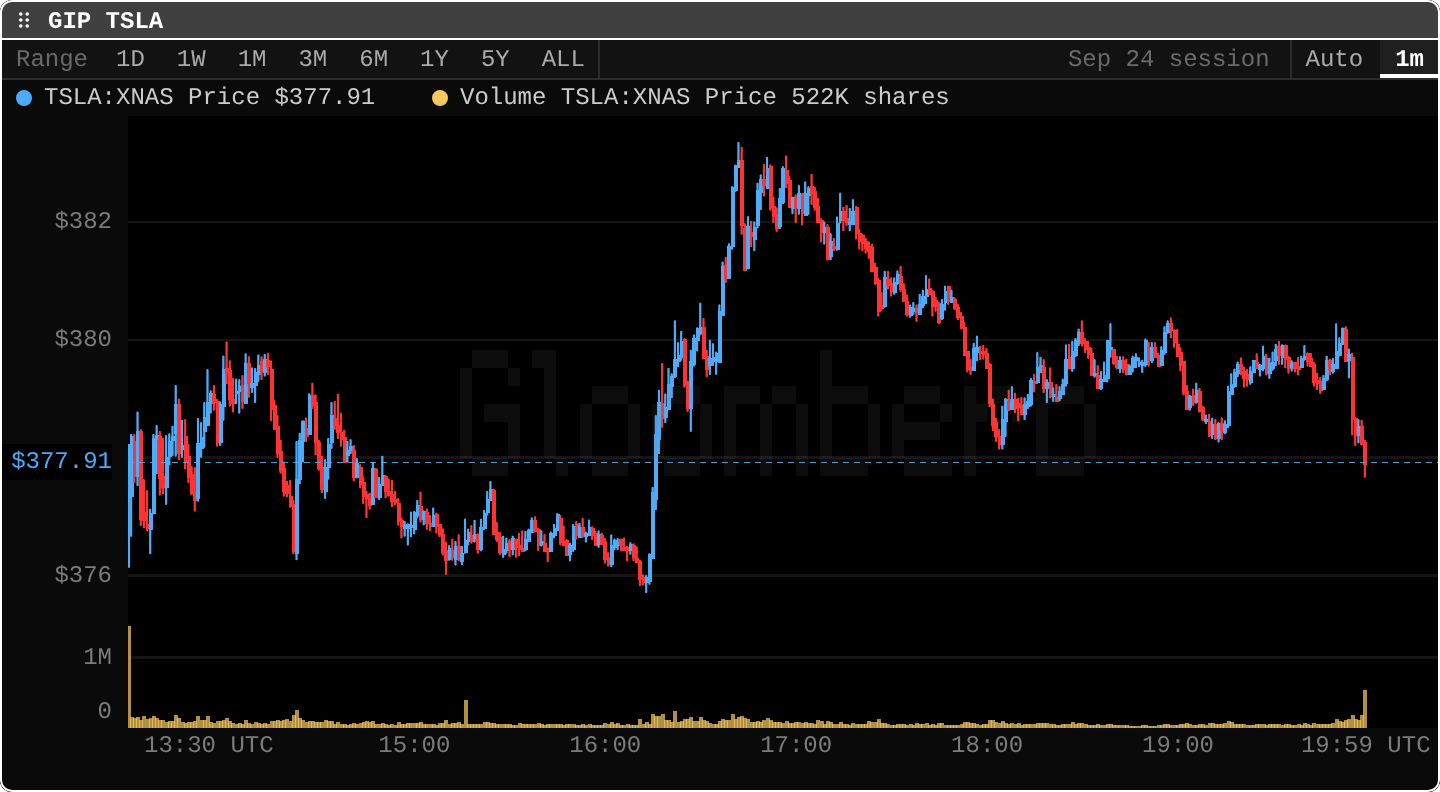
open itGIP TSLA, then i for Indicators.
- VWAP: pick it, then
bsets the number of bands (whole standard deviations, volume-weighted, above and below). - Anchored VWAP: turn it on, then click the bar to start from (or press Enter at the keyboard cursor). Press
afor its anchors; you can also type a date like2026-09-30. Up to eight anchors per chart. - Bollinger Bands: 20 bars, 2 standard deviations by default;
pchanges the period. - ATR: 14 bars by default, in its own panel below the price.
- Volume profile:
nsets how many price rows. - Price levels: press
Shift+H(or═in the toolbar). Click to add a level, drag to move it,Backspacedeletes the picked one.
The dialog also has realized volatility (how much the price actually moved, annualized). Chapter 6 teaches it.
Practice and recap
Try it3 tasks
- Compute VWAP for 200 shares at $50 and 50 shares at $52.
- Previous close $20, today high $20.50, low $18.50. What is the true range?
- Which of the two charts in this section can show a VWAP line:
GP AAPLon 5 years of weekly candles, orGIP TSLAon one session of one-minute bars? Why?
Common mistakes4 mistakes
- Turning on VWAP on a daily or weekly chart. It is a one-session average and needs intraday bars.
- Reading a touch of the upper Bollinger Band as "sell". It only means "unusually high for the last 20 bars".
- Using ATR from one-minute bars to size a multi-day decision.
- Forgetting that levels you draw appear on every chart of that ticker.
Check yourself3 questions
- 300 shares at $10 and 100 at $14. VWAP?
- When do Bollinger Bands get wider?
- What does the point of control mark?
Answers
- (3,000 + 1,400) / 400 = $11.00.
- When prices swing more around their 20-bar average.
- The price row where the most volume traded in the bars on screen.
Words in this lesson10 words
- VWAP
- average price of the session's trades, weighted by shares
- anchored VWAP
- the same average started from a bar you choose
- standard deviation
- the typical distance of values from their average
- Bollinger Bands
- lines 2 standard deviations above and below a 20-bar average
- true range
- the largest of high minus low and the gaps to the previous close
- ATR
- the average true range over 14 bars
- volume profile
- volume counted by price instead of by time
- point of control
- the price row with the most volume
- value area
- the price band holding 70% of the volume
- price level
- a horizontal line you draw at a price, optionally with an alert
Educational material about reading market data, not investment advice.