Moving averages, RSI and MACD (chart indicators)
Indicators are formulas on past prices drawn on the chart: moving averages smooth the noise, RSI measures how one-sided recent moves were, and MACD compares a fast average with a slow one.
- 5 min
- 3 questions
- Lesson 3 of 5
Why you would care
You will hear "it broke its 200-day", "RSI is 80, it's overbought", "MACD just crossed". These are not mysteries. Each one is a simple calculation on the closes you already see. Once you can do the arithmetic, you can judge how much (or how little) the sentence means.
The idea from scratch
An indicator (Gloom also says study) takes past prices, sometimes volume, and turns them into a new line. It never sees the future. It only re-arranges the past.
Moving average (SMA and EMA)
A simple moving average (SMA) of 5 days is the average of the last 5 closes. Tomorrow you drop the oldest close and add the newest, so the average "moves".
Illustrative closes: 10, 11, 12, 11, 13. SMA(5) = 57 / 5 = 11.4. Next day closes at 14: drop the 10, add the 14. SMA(5) = 61 / 5 = 12.2.
- A longer window (200 days) is smoother and slower. A shorter one (20 days) hugs the price.
- An exponential moving average (EMA) gives recent days more weight, so it reacts faster than an SMA of the same length.
- Price above its 200-day SMA is a common shorthand for "the long trend is up". A golden cross is the 50-day SMA crossing above the 200-day; a death cross is the opposite.
RSI: how one-sided were the last 14 days?
The Relative Strength Index (RSI) looks at the last 14 bars and compares the average size of the up moves with the average size of the down moves. It always lands between 0 and 100.
- Mostly up days: RSI near 100. Mostly down days: near 0. Balanced: near 50.
- Traders call above 70 overbought and below 30 oversold. These are labels, not forecasts: a strong stock can sit above 70 for weeks.
Go deeper: the RSI formula
RS = average gain / average loss over the period. RSI = 100 - 100 / (1 + RS). Example: average gain $1.00, average loss $0.50, so RS = 2 and RSI = 100 - 100/3 = 66.7.
MACD: fast average minus slow average
MACD (moving average convergence divergence) is the 12-period EMA minus the 26-period EMA. When recent prices rise faster than older ones, the line goes up.
A second line, the signal line, is a 9-period EMA of the MACD line itself. "MACD crossed its signal" means the MACD line moved above (or below) that smoother copy of itself.

See it in Gloom
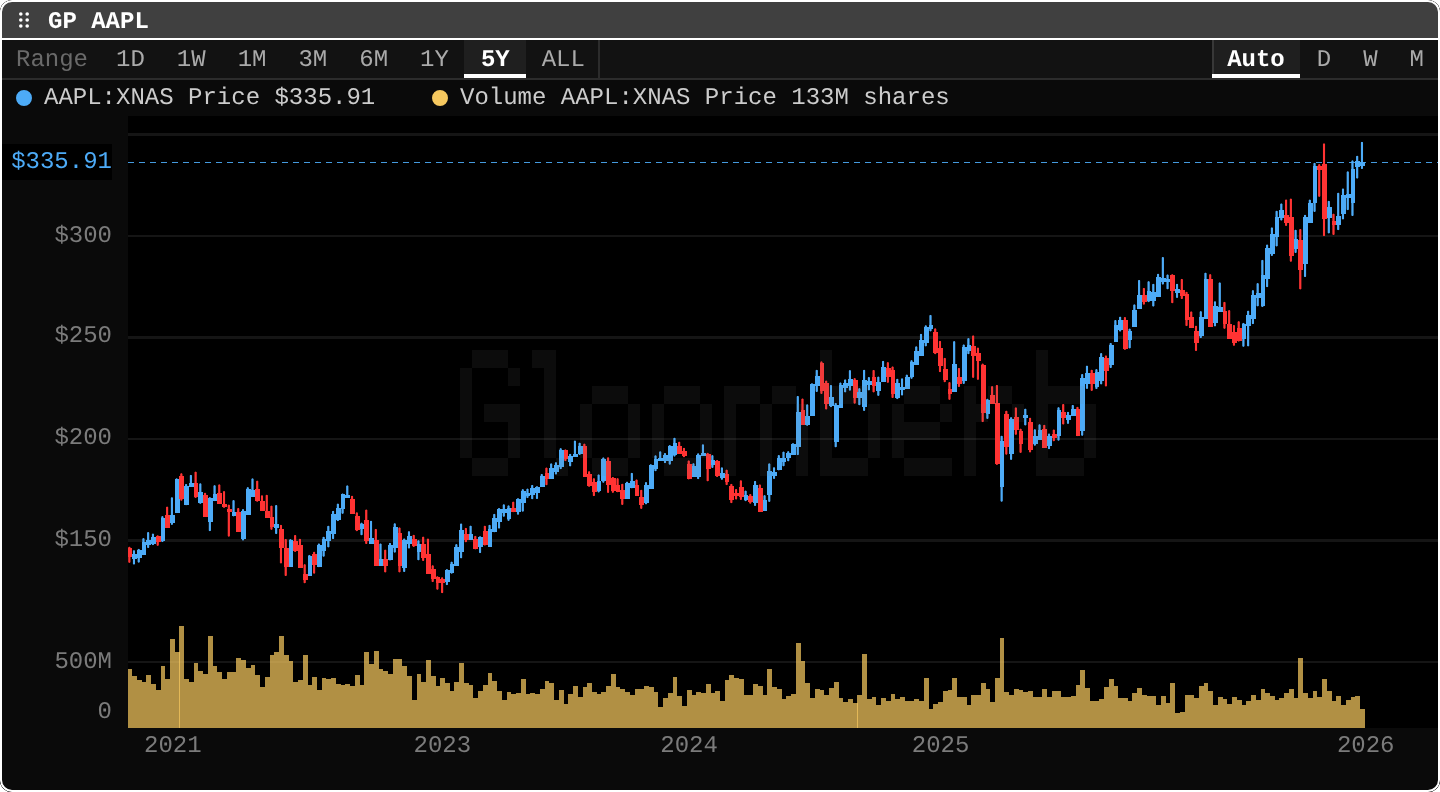
open ittype GP AAPL, then press i for the Indicators dialog.
What you find there:
- Moving averages: SMA 20, SMA 50, SMA 200 and EMA 20. They draw on top of the price.
- RSI with a 14-bar period. It gets its own panel below the chart.
- MACD with 12, 26 and 9. Its own panel too.
- Period (
p): with SMA, EMA, RSI, Bollinger or ATR highlighted, the setting beside Done changes its length. - The same dialog holds Bollinger Bands, VWAP, volume profile, ATR and realized volatility: see the next lesson.
The legend at the top names each line. Click an entry to hide or show it.
Practice and recap
Try it3 tasks
- Compute SMA(3) for the closes 20, 22, 24, then again after a new close of 18.
- On the screenshot above, eyeball where a 200-day average would run through 2025: above or below the price most of the year?
- A stock went up 10 days in a row by small amounts and down 4 days by small amounts. Is its RSI above or below 50?
Common mistakes4 mistakes
- Treating "overbought" as "about to fall". It only says recent moves were mostly up.
- Forgetting that every indicator lags. A moving average turns after the price has turned.
- Comparing an SMA 50 on weekly bars (50 weeks) with one on daily bars (50 days).
- Stacking five indicators that are all built from the same closes and calling it five confirmations.
Check yourself3 questions
- Closes 4, 6, 8, 10. What is the SMA(4)?
- Which reacts faster to a sudden move: SMA 20 or EMA 20?
- What two lines does a "MACD cross" refer to?
Answers
- 28 / 4 = 7.
- EMA 20, because it weights recent closes more.
- The MACD line (EMA 12 minus EMA 26) and its signal line (an EMA 9 of the MACD line).
Words in this lesson8 words
- indicator (study)
- a formula on past prices or volume, drawn as a line
- SMA
- simple moving average: the plain average of the last N closes
- EMA
- exponential moving average: an average that weights recent closes more
- golden cross / death cross
- the 50-day SMA crossing above / below the 200-day SMA
- RSI
- a 0 to 100 score of how one-sided recent up and down moves were
- overbought / oversold
- RSI above 70 / below 30; labels, not forecasts
- MACD
- the 12-period EMA minus the 26-period EMA
- signal line
- a 9-period EMA of the MACD line
Educational material about reading market data, not investment advice.