Grades within a sector (EQS)
EQS grades every covered company from F to A+ on Value, Growth, Profitability, Momentum and Revisions against the other companies in its sector, and blends the five into a composite from Bottom to Top.
- 5 min
- 3 questions
- Lesson 8 of 9
Why you would care
Is a P/E of 25 expensive? For a utility, probably. For a software company, maybe not. Raw numbers mean different things in different industries, so comparing a company with its own sector is fairer. A grade does that comparison for you and says it in one letter.
The idea from scratch
A percentile says where a value ranks in a group: 80 means it beats 80% of the group.
Each grade reads a few fields. Every field is ranked among the companies of the same sector, the percentiles are averaged, the average is ranked within the sector again, and the result is cut into thirteen equal bands: F, D-, D, D+, C-, C, C+, B-, B, B+, A-, A, A+. A+ is the top 7.7% of its sector.
| Grade | Fields (each ranked within the sector) |
|---|---|
| Value | P/E, forward P/E, P/B, EV/EBITDA, EV/revenue (lower is better), FCF yield |
| Growth | revenue and EPS growth over 3 years, and the growth analysts expect this fiscal year |
| Profitability | gross, operating and net margin, ROE, ROIC, return on capital |
| Momentum | the 3-month return, the 1-year total return, the distance from the 52-week high |
| Revisions | the 30-day change in analysts' EPS forecasts (this year and next) and revenue forecast |
The composite averages the five grades' percentiles with equal weights (20% each), ranks the averages across every graded company and scales them from 1 to 5. Its labels split the companies in fixed shares: Top (4.5 and up) an eighth, Strong, Neutral and Weak a quarter each, Bottom an eighth.
A few rules keep it honest:
- A grade needs at least two of its fields, and the composite three grades.
- A field that means nothing (
N/M, like a P/E over a loss) is left out, not counted as the worst. - A sector with fewer than 20 companies that have a field ranks it against every company instead.
- Share classes (GOOGL and GOOG) count once, on the most traded line, and show the same grades.
- Fields: P/E, margins, returns...
- Percentile within the sector
- Five grades, F to A+
- Composite 1 to 5: Bottom to Top
See it in Gloom
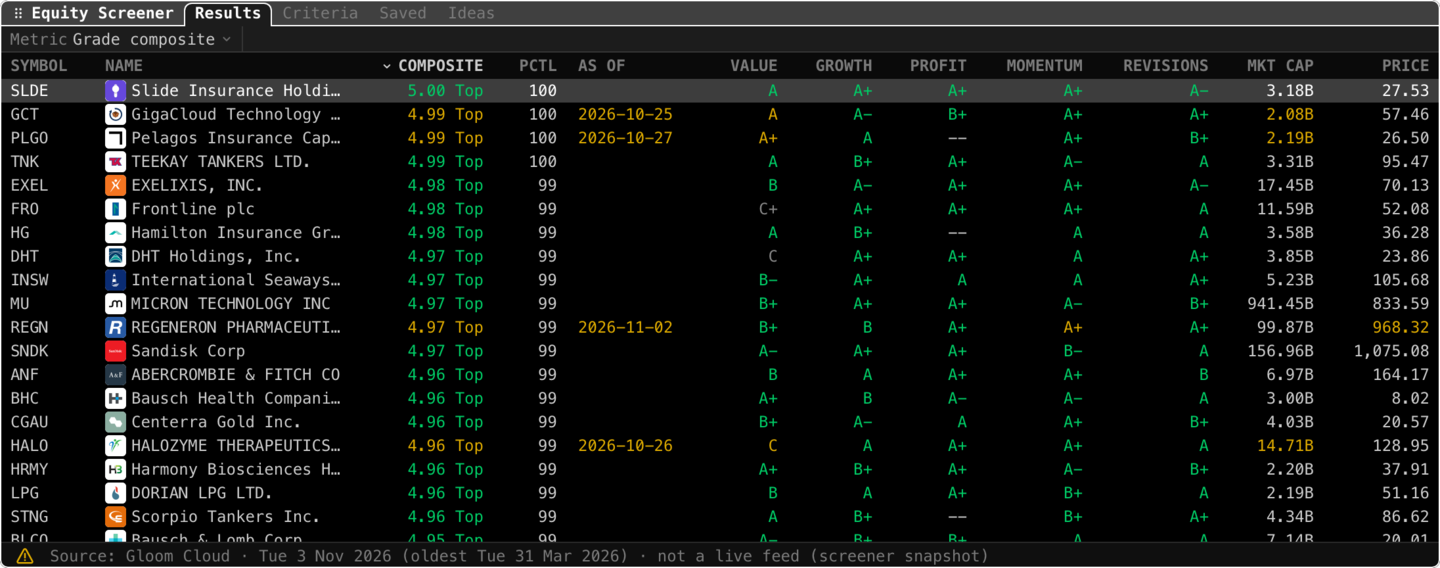
Open ittype EQS, go to Ideas and open Top grades, or add a grade as a criterion: Value grade >= B+. Shell: gloom fn EQS --preset top-grades.
Metric Grade composite: the Top grades idea keeps a composite of 4.5 or more, the Top label, and ranks it highest first.SLDE 5.00 Top A A+ A+ A+ A-: top of its sector on growth, profitability and momentum, near it on value and revisions.MU 4.97 Top B+ A+ A+ A- B+: Micron is Top without being the cheapest in its sector.--underPROFIT: too few fields to grade; the composite uses the other four.- A yellow
AS OFdate: a field the grades read is stale, so the grade is stale too. - Colours: B- and up in green, D+ and down in red, the C grades plain.
Enter on a company shows each grade's sector percentile and every field behind it, with its value and percentile.
Save to Watchlist… in the pane menu (.) saves the first 100 matches of any screen, in the order shown, to a new watchlist named after the screen or to one you already have.
Practice and recap
Try it3 tasks
- A grade cuts a sector into thirteen bands. Roughly what share of a sector gets an A+? (About 7.7%.)
- In the shot, which grade does Micron score lowest on? (Value and Revisions, both B+.)
- A company has an A+ in Value but no earnings. What should you check? (Its P/E is left out, so the Value grade rests on the other fields and can read flattering.)
Common mistakes3 mistakes
- Comparing grades across sectors: an A in utilities and an A in software are ranked against different peers.
- Reading Top as "buy": it is a rank against other companies, not a forecast.
- Forgetting that a missing field changes what a grade rests on.
Check yourself3 questions
- Against whom is a company's grade ranked?
- What share of graded companies is labelled Top?
- Why are share classes graded once?
Answers
- The other companies in its sector (all companies when the sector has fewer than 20 with the field).
- An eighth.
- They are one company; grading each line would count it twice.
Words in this lesson4 words
- percentile
- Where a value ranks in a group, 0 to 100.
- grade (EQS)
- A letter, F to A+, ranking a company within its sector on a few fields.
- grade composite
- The five grades blended into a 1 to 5 score, Bottom to Top.
- estimate revision
- A change in analysts' forecasts.
Educational material about reading market data, not investment advice.