Your own intraday scan (SCAN)
SCAN watches US stocks through the trading day and lists the ones that match your intraday conditions right now (a fast move, a burst of volume, a new high or low, a VWAP cross, a gap), and can alert you when a new one appears.
- 5 min
- 3 questions
- Lesson 9 of 9
Why you would care
Something is moving fast on heavy volume, but which stock?
EQSscreens on daily figures; by the time a daily number changes, the move is over. A scanner asks the same kind of question about the last few minutes, again and again through the session.
The idea from scratch
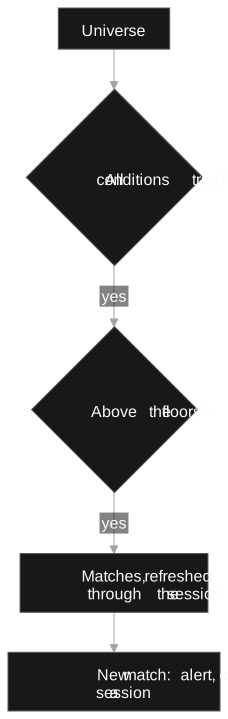
A live scan has three parts:
Universe
where to look. All US stocks, the S&P 500, MidCap 400 or SmallCap 600, the Russell 1000 or 2000, one sector, or one of your watchlists.
Conditions
what must be happening. Every condition must hold at once.
Floors
a minimum price, market cap and volume so far, to keep out tiny, thin names.
The conditions you can set:
- Move
- Up, down or either way by at least a percent over the last 1, 5, 15, 30 or 60 minutes
- Volume spike
- Volume over a window, or the day so far, against the usual pace
- New high / low
- A new high or low for the session, printed within a window
- VWAP cross
- Crossed the session's VWAP within a window and still on that side
- Gap
- The open's distance from the previous close
VWAP (volume-weighted average price) is the session's average price, with big trades counting more.
The usual pace spreads the average day (over the last 20 sessions) evenly over the 390 minutes of the session.
The default scan: a move of at least 1% either way in 5 minutes, on at least 2x the usual 5-minute volume, at 5 dollars or more and 300 million of market cap or more.
See it in Gloom
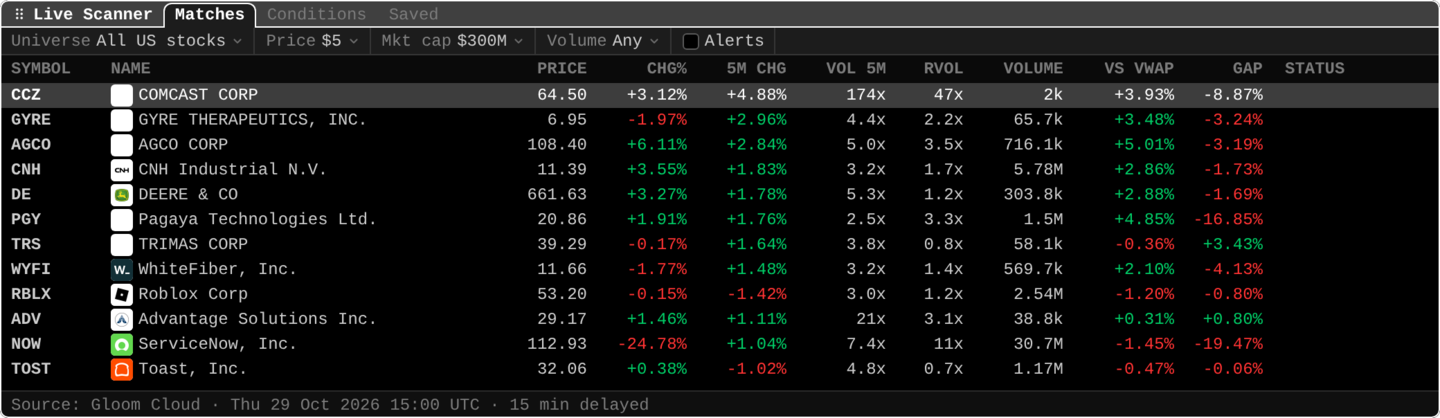
Open ittype SCAN. Tabs: Matches, Conditions (a adds one), Saved (s saves the scan, Enter opens a saved one). The bar holds the universe, the floors and the Alerts switch.
5M CHGandVOL 5M: one column per condition, with the figure the stock matched on. Matches are sorted by the first condition, strongest first; click a header to sort by another column.DE ... +1.78% 5.3x: Deere rose 1.78% in 5 minutes on 5.3 times its usual 5-minute volume.NOW ... -24.78% ... +1.04% ... 11x: down a quarter on the day, bouncing in the last 5 minutes.RVOL 11x: the day's volume so far is 11 times the usual pace.VS VWAPandGAP: where the price sits against the session's VWAP, and how far it opened from yesterday's close.STATUS(empty here):newfor a match from the last refresh,alertedwith its time,stalewhen the last trade is more than 5 minutes old, as for a halted stock.
Turn on Alerts and each stock that newly matches alerts once a session, in the app and in ALRT's History. It keeps watching while the pane is covered or the app is in the background, as long as the pane is in your open layout.
Practice and recap
Try it3 tasks
- Average day 7.8 million shares. What is the usual 5-minute volume? (7.8M / 390 x 5 = 100,000.)
- Write a scan for "S&P 500 stocks that just made a new session high on heavy volume". (Universe S&P 500; new high within 5 minutes; volume spike 2x over 5 minutes.)
- In the screenshot, which match is furthest above its VWAP? (AGCO, +5.01%.)
Common mistakes4 mistakes
- Reading a delayed scan as live: on Free, every match is 15 minutes old.
- Setting no price or volume floor and drowning in tiny, thin stocks.
- Treating a match as a signal to trade. It says what is happening, not what comes next.
- Expecting alerts from a scan whose pane you closed.
Check yourself3 questions
- What is the difference between
EQSandSCAN? - What does a 3x volume spike over 5 minutes mean?
- Why might a long-window condition match nothing at the open?
Answers
EQSscreens daily figures;SCANwatches what is happening during the session.- The last 5 minutes traded three times the usual 5-minute volume.
- The scanner has not yet watched that much of the session.
Words in this lesson6 words
- scanner (live scan)
- A screen re-run through the session on what prices and volume are doing now.
- universe
- The set of stocks a scan looks through.
- floor
- A minimum (price, market cap, volume) a match must clear.
- volume spike
- Volume over a window divided by the usual volume for that much time.
- VWAP
- The session's average price, with big trades counting more.
- session high / low
- The highest / lowest price of today's session so far.
Educational material about reading market data, not investment advice.